|
|
|

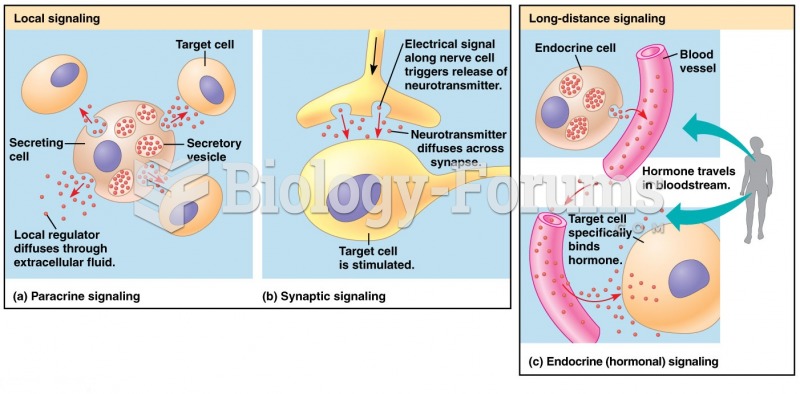 Local/long distance cell Signaling
 A container with gasoline containing alcohol. Notice the separation line where the alcohol-water ...
 A downward-sloping spark line usually indicates high secondary ignition system resistance or an ...
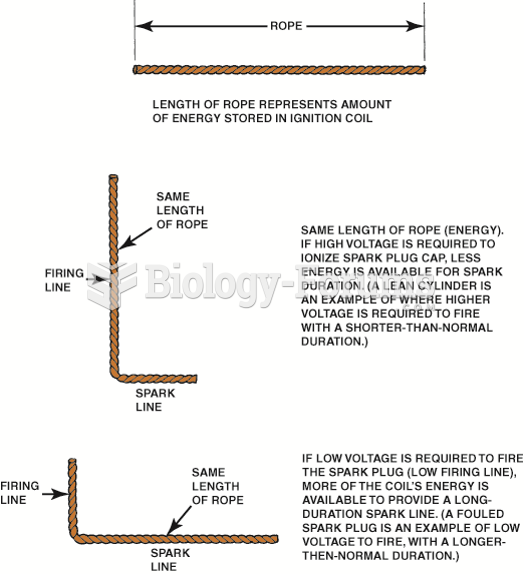 The relationship between the height of the firing line and length of the spark line can be ...
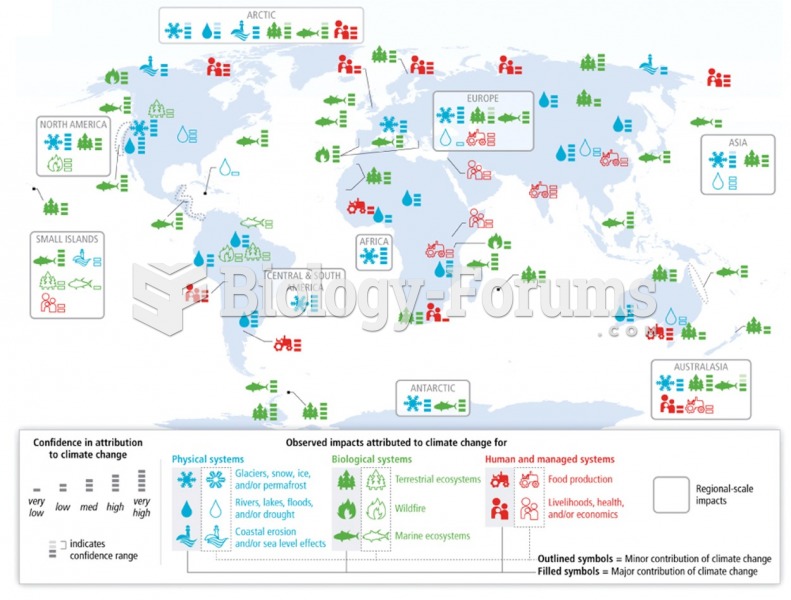 Current and future trends and impacts (IPCC)
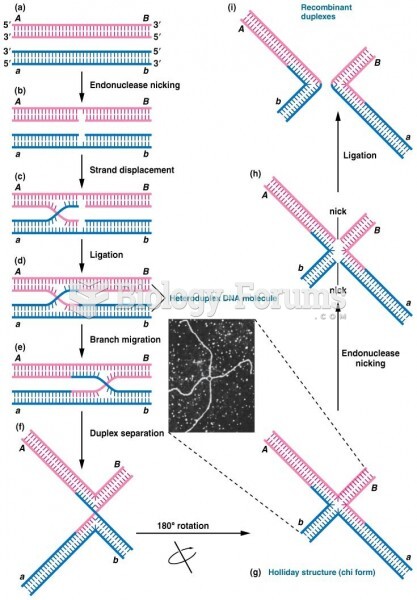 Model depicting how genetic recombination