|
|
|

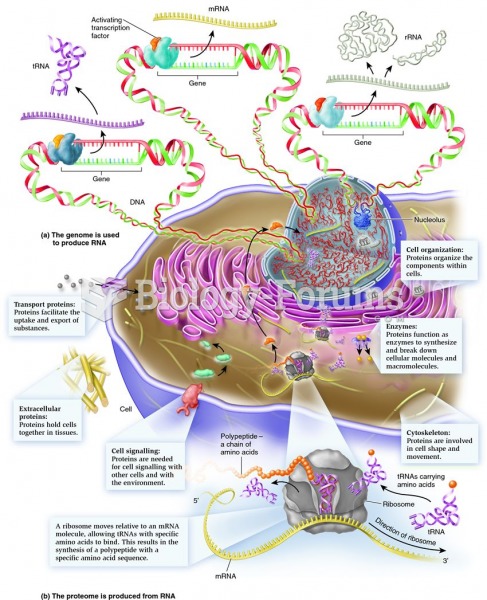 Information flows from the nucleus to the cytoplasm and back.
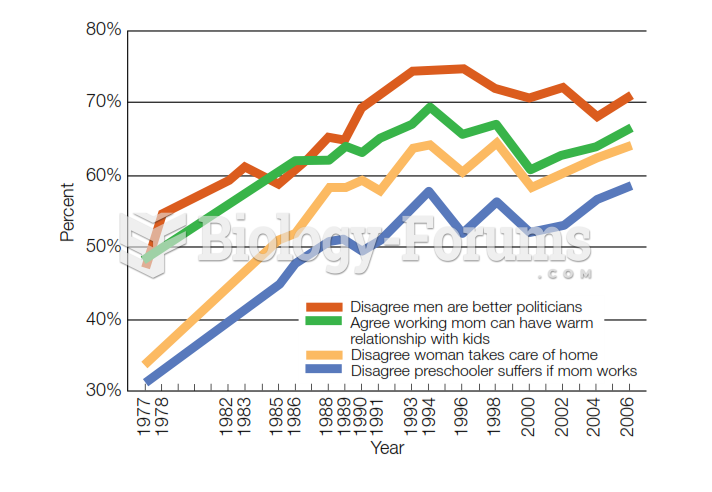 Change in American Gender Attitudes, 1977-2006 Over recent decades, views of gender roles have beco
 Change in Annual Precipitation Over Land, 1901-2010
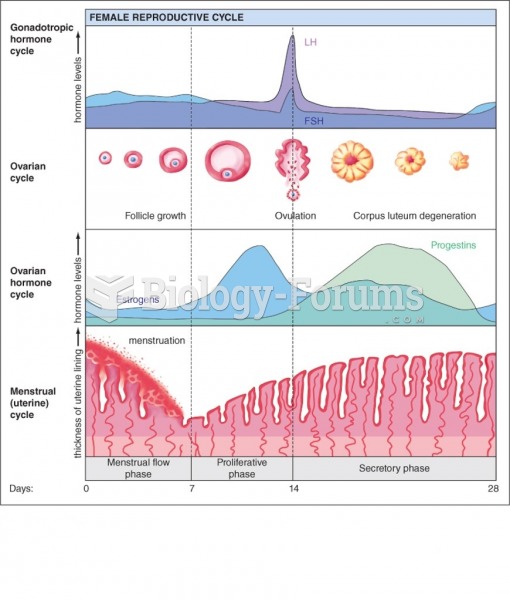 Hormonal change during ovulation and urinear cycles
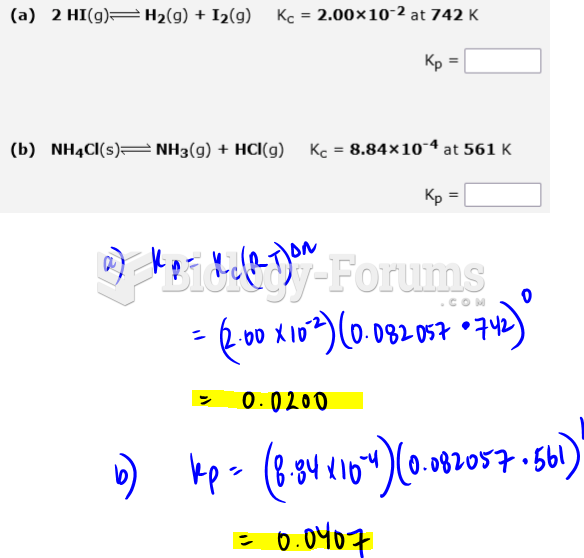 Calculate KP for the following reactions at the indicated temperature.
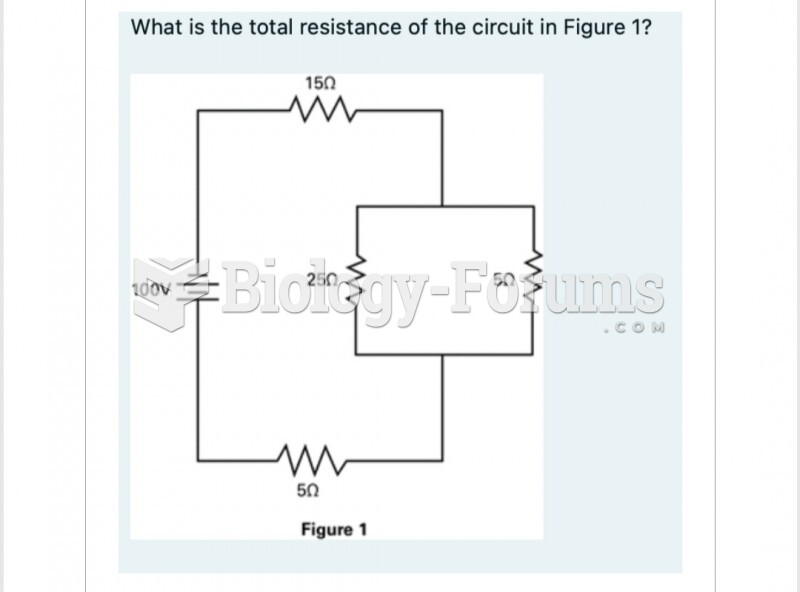 What is the total resistance of the circuit in Figure 1? 150