|
|
|

Did you know?
Methicillin-resistant Staphylococcus aureus or MRSA was discovered in 1961 in the United Kingdom. It if often referred to as a superbug. MRSA infections cause more deaths in the United States every year than AIDS.

 Sharing patient information with colleagues is an important nursing role
 Figure of a Woman with a Drawing Showing Evidence of Original Painting and Outlining Design Scheme
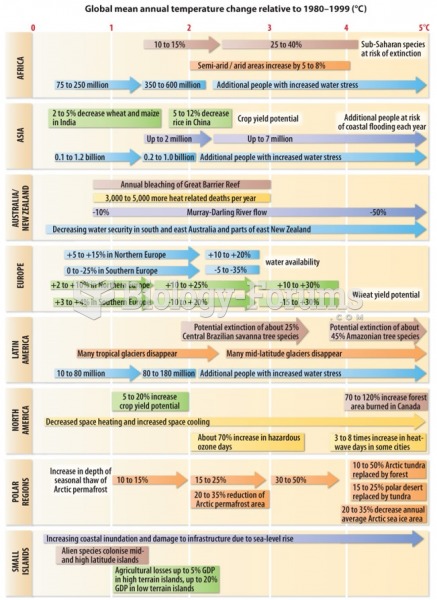 The impact of climate change is greater in some areas than in others
 Figure and Ground
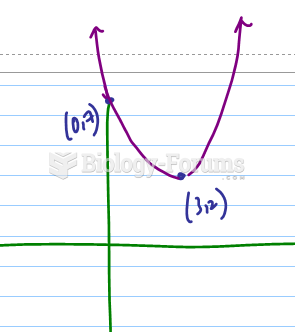 If a graph has the following x-intercepts, which value of x is the instantaneous rate of change ...
 . Calculate the net electric field at point B