|
|
|

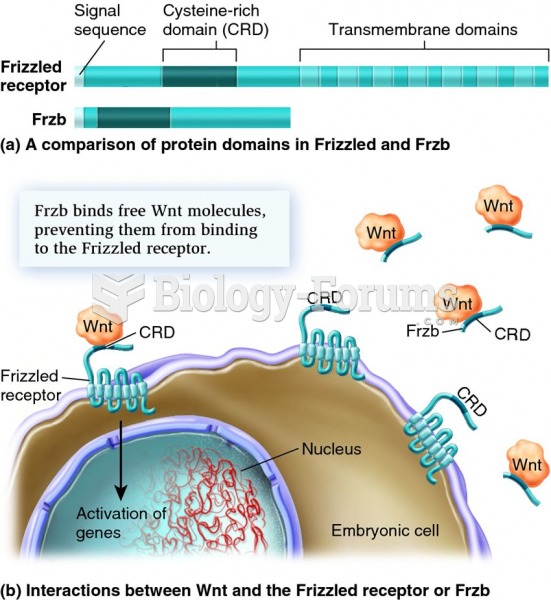 The actions of Frzb and the Frizzled receptor protein show how embryonic development represents a ba
 Demonstrate the Application of Triangular, Figure-Eight, and Tubular Bandages
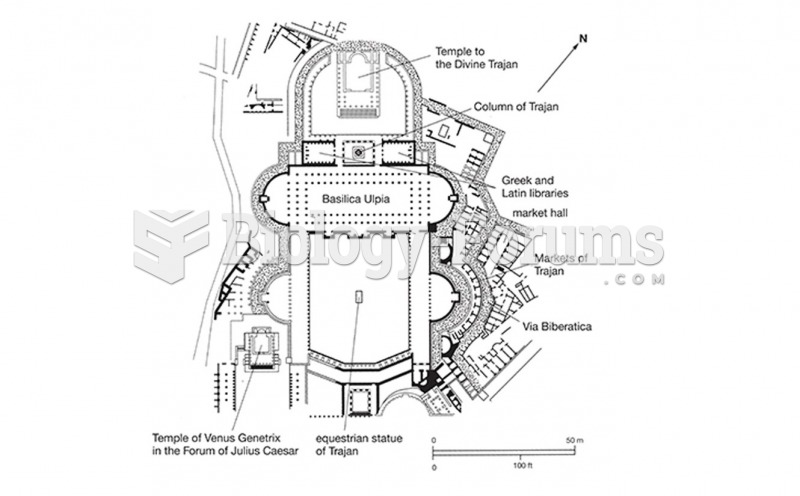 Plan of Trajan's Forum and Market "خطة منتدى ترجان والسوق"
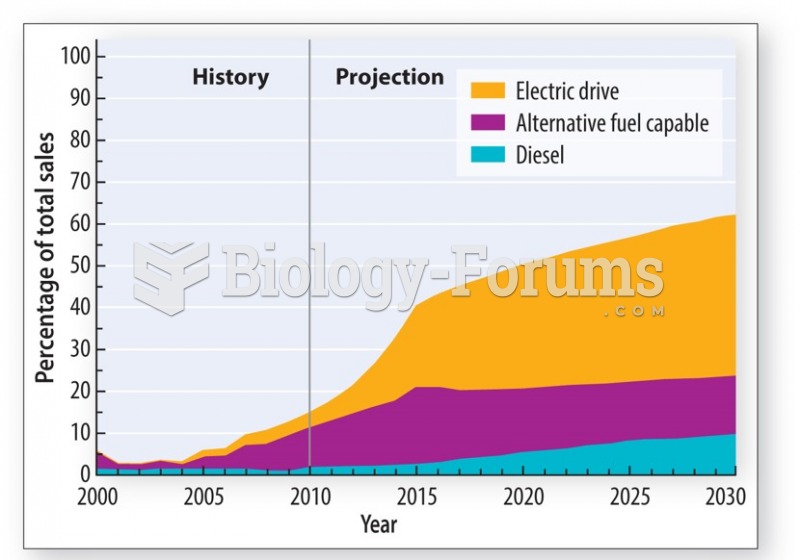 The introduction of a new generation of electric and hybrid cars will reduce the demand for oil
 Economic recession in 2008 saw a small decrease in demand
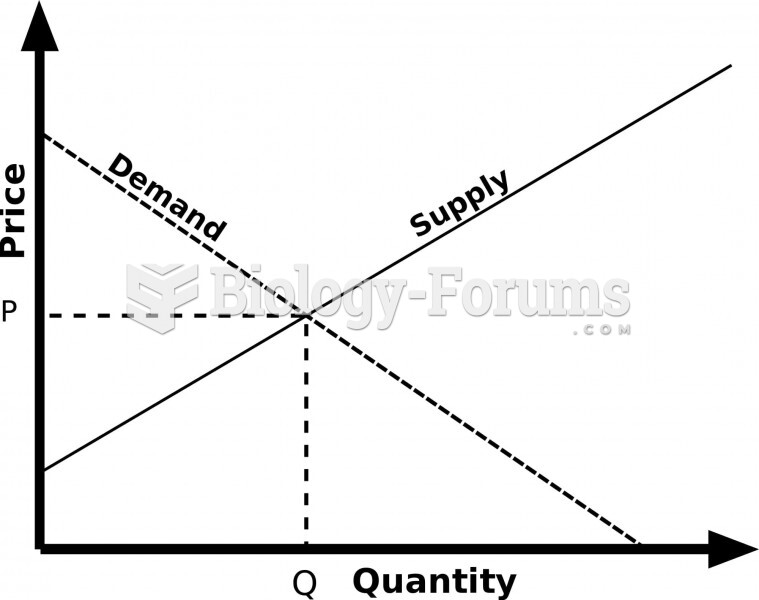 The original Supply and Demand graph