|
|
|

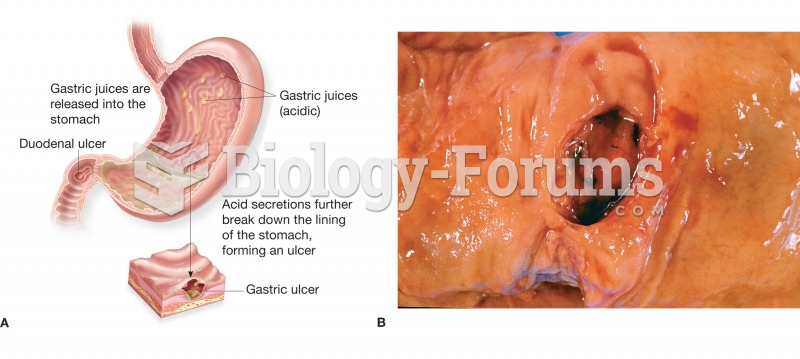 (A) Figure illustrating the location and appearance of a peptic ulcer in both the stomach and the du
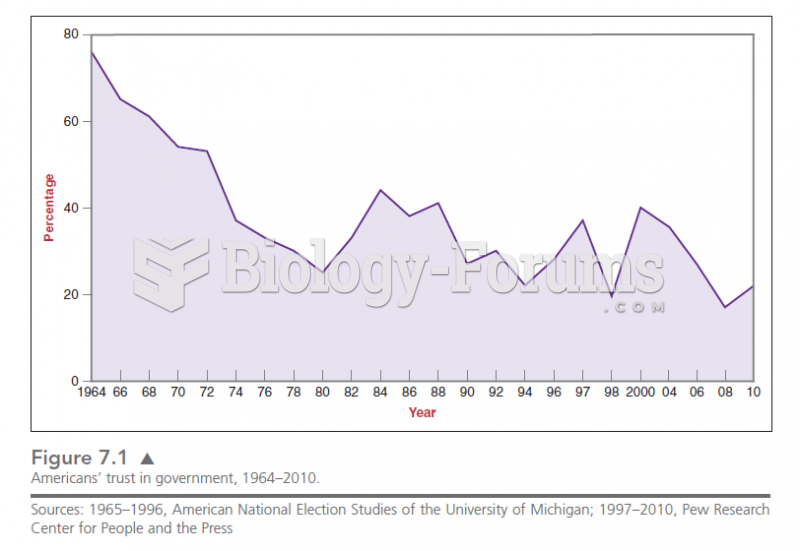 Figure 7.1 shows the rapid decline in the trust of Americans in government since the 1960s. This de
 Mobilize each metatarsal–phalangeal joint with figure-8s. Hold the tarsal just below the ...
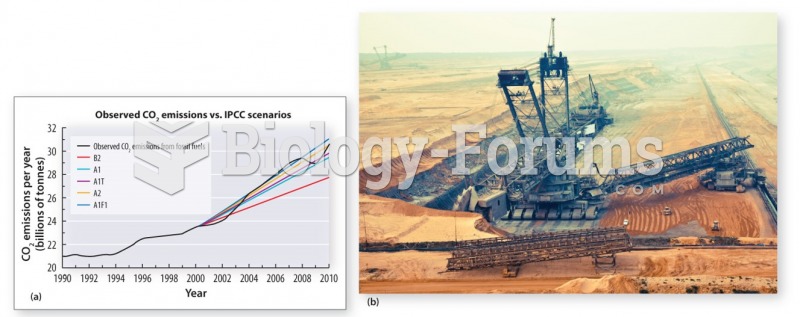 The demand for energy is met by burning coal and other fossil fuels
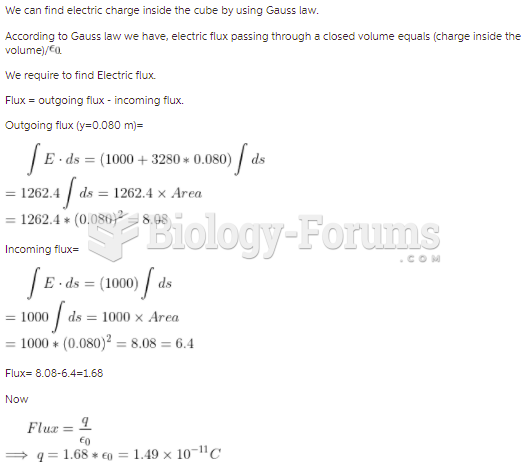 The cube of insulating material shown in the figure has one corner at the origin. Each side of ...
 Figure 2.15.jpg