|
|
|

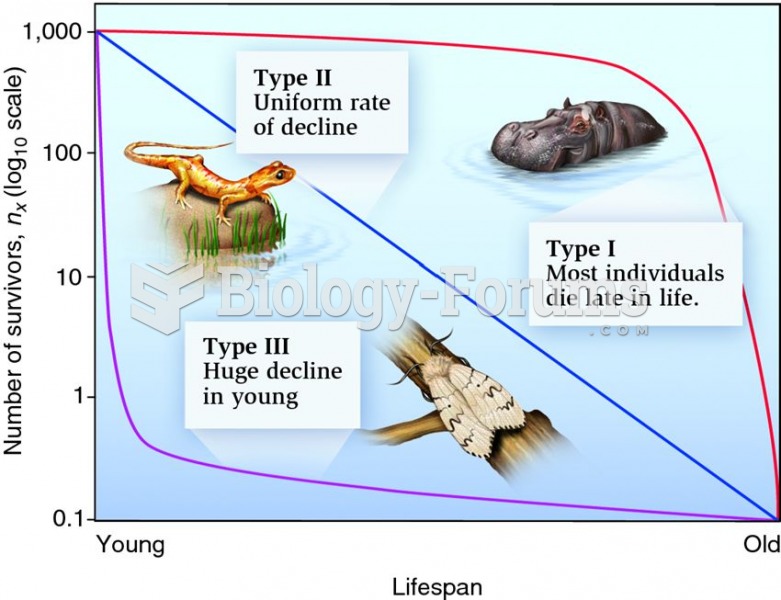 Idealized survivorship curves.
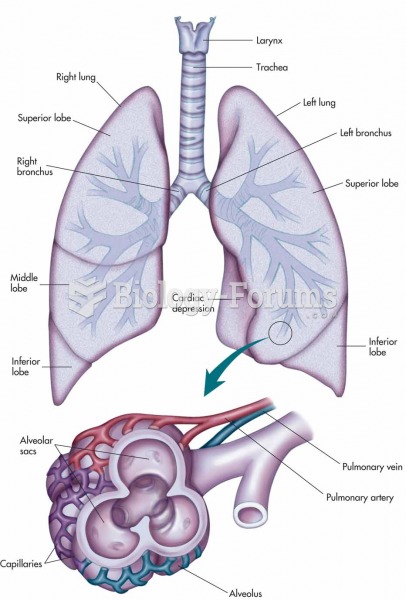 Larynx, trachea, bronchi, and lungs with an expanded view showing the structures of an alveolus and
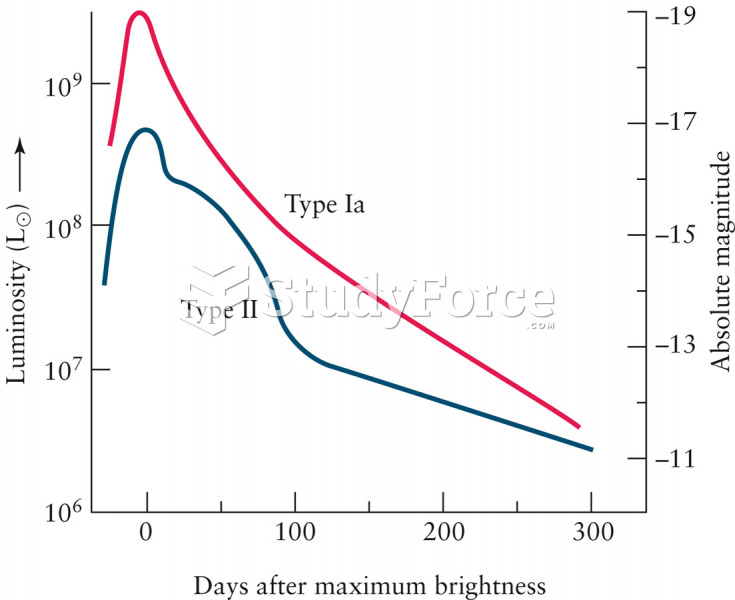 Supernova Light Curves
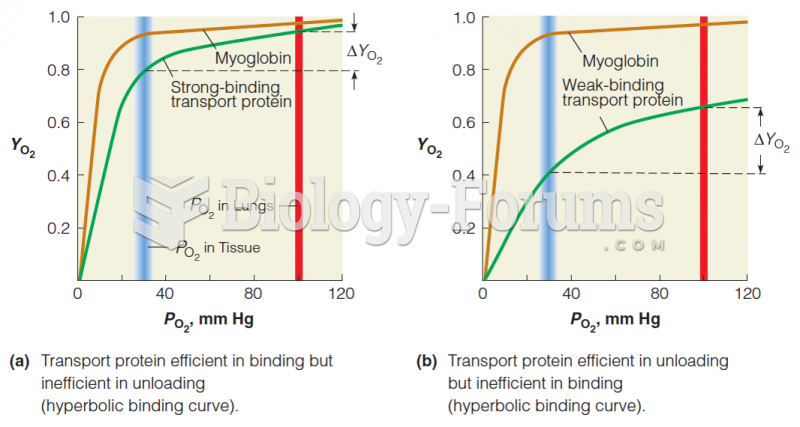 Cooperative vs. noncooperative O2-binding curves
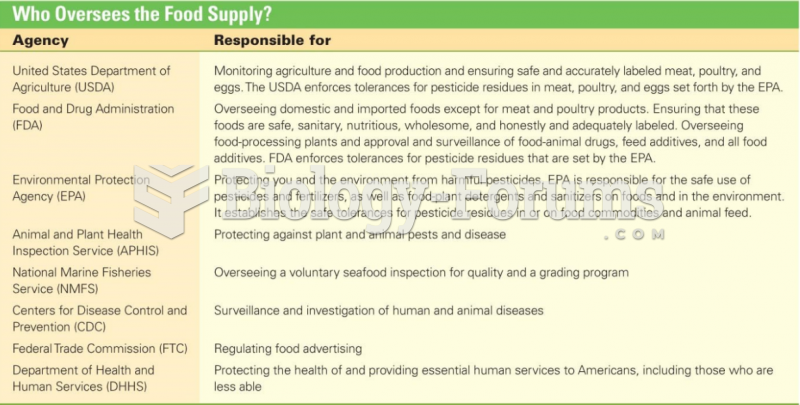 Who Oversees the Food Supply?
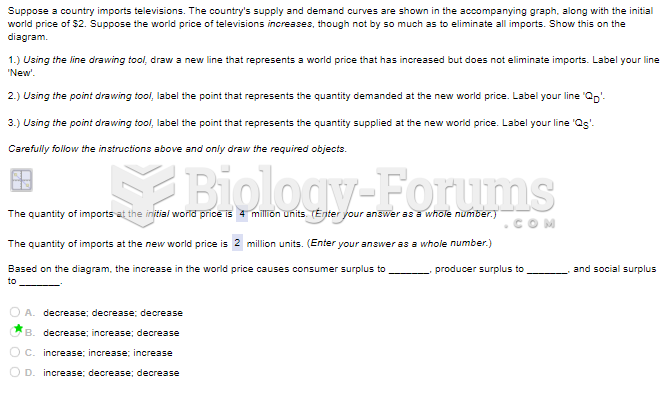 Suppose a country imports televisions. The country's supply and demand curves are shown in ...