|
|
|

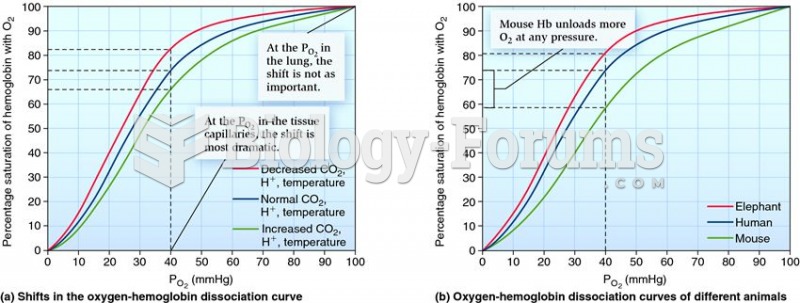 Differences in oxygen-hemoglobin dissociation curves under different physiological conditions and am
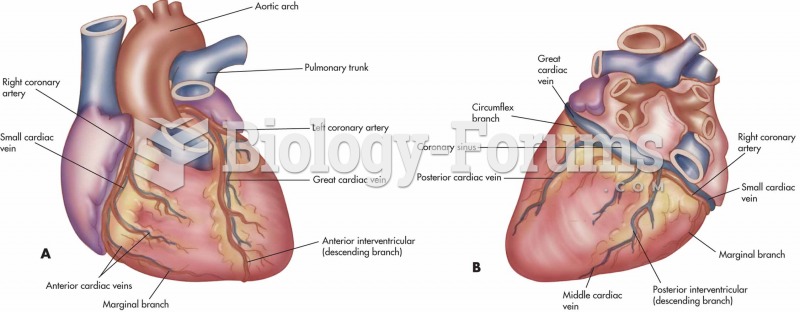 Coronary circulation. (A) Coronary vessels portraying the complexity and extent of the coronary circ
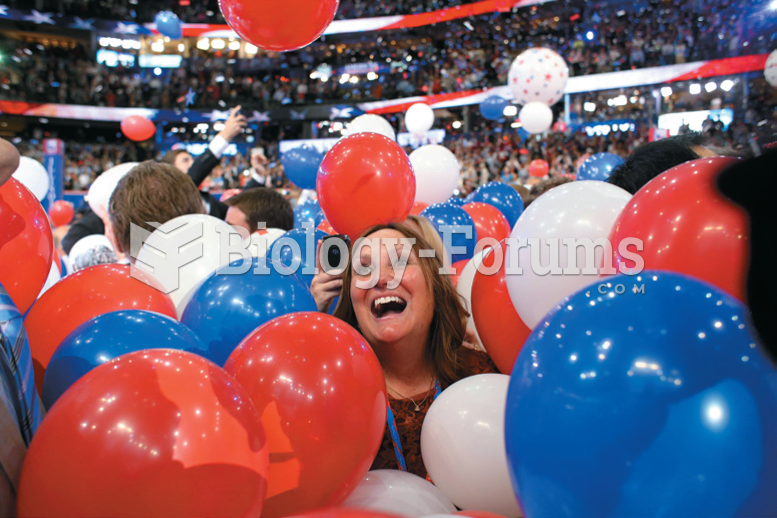 Although the Democrats and the Republicans represent slightly different slices of the center, those ...
 Apply scissoring between metatarsals and figure-8s on toe joints to mobilize the foot.
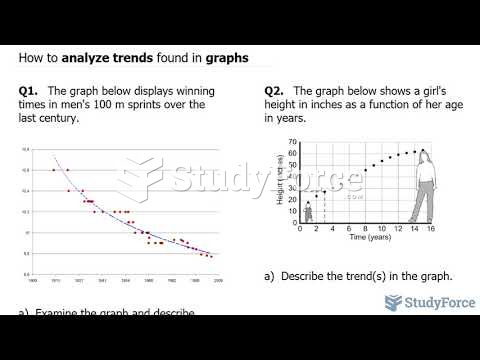 How to analyze trends found in graphs
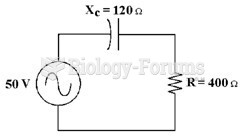 If the frequency equals 60 Hz in Figure 10-1, what is the value of capacitance?