This topic contains a solution. Click here to go to the answer
|
|
|

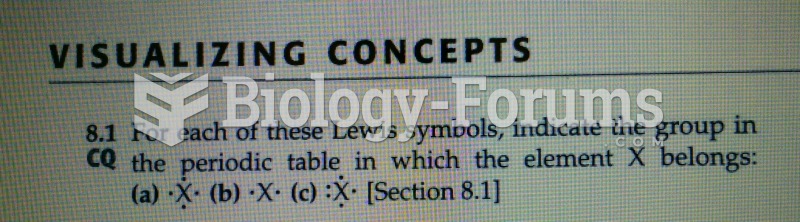 Lewis symbols,(Figure 1)
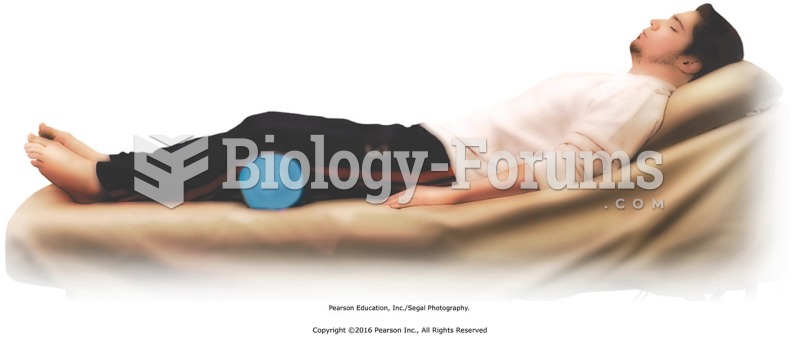 Semireclining position. Back supported and placement of bolster under the knees.
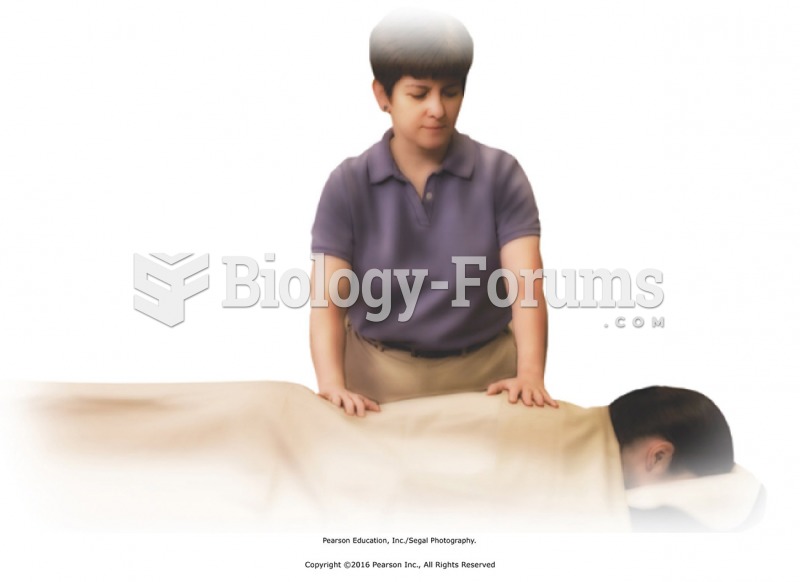 Finishing techniques for the back of the body. With the recipient fully draped, gently rock the body ...
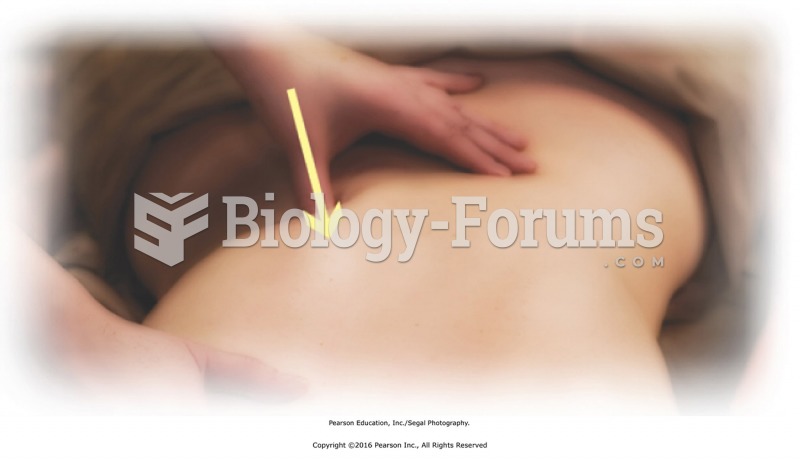 Apply direct pressure to points on low back. Press into paraspinal muscles from the side. Move spot ...
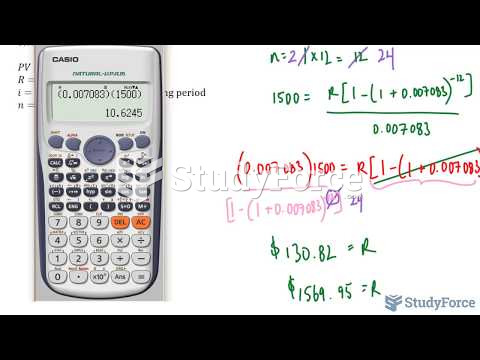 How to choose the right payment plan with changing conditions (Question 3)
 Figure and Ground