The figure above shows a monopoly's total revenue and total cost curves. The monopoly's marginal revenue equals its marginal cost when it produces
A) 0 units of output.
B) 5 units of output.
C) 15 units of output.
D) 20 units of output.
Question 2
The increase in the demand for widgets, shown in the figure above, is the result of a decrease in the price of McBoover devices. Therefore
A) widgets and McBoover devices are substitutes.
B) widgets and McBoover devices are complements.
C) widgets are a normal good.
D) McBoover devices are a normal good.

 Hyperopia (farsightedness). In the uncorrected top figure, the image would come into focus behind th
 The accessory organs of the digestive system: the liver, gallbladder, and pancreas. Image shows the
 A Total Eclipse of the Sun
 Monopoly, patented in 1935, was an instant best-seller: Players risk all their assets in an attempt
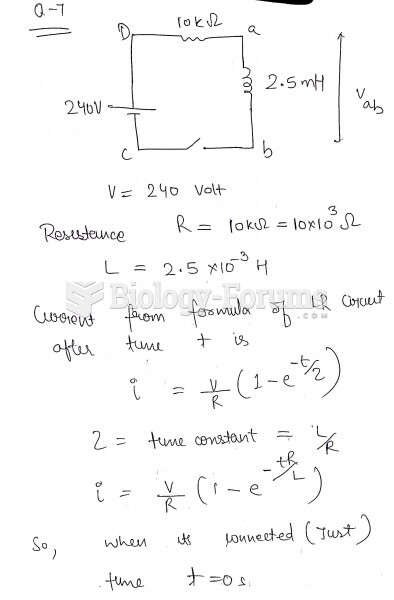 The figure shows an LR circuit with a switch and a 240-volt battery. At the instant the switch ...
 A bell-shaped, or “normal,” curve shows the distribution of phenotypes for traits controlled by ...