The figure above shows a monopoly's total revenue and total cost curves. The monopoly's marginal revenue equals its marginal cost when it produces
A) 0 units of output.
B) 5 units of output.
C) 15 units of output.
D) 20 units of output.
Question 2
The increase in the demand for widgets, shown in the figure above, is the result of a decrease in the price of McBoover devices. Therefore
A) widgets and McBoover devices are substitutes.
B) widgets and McBoover devices are complements.
C) widgets are a normal good.
D) McBoover devices are a normal good.

 This red-bellied lemur shows clearly the traits that characterize strepsirhine primates.
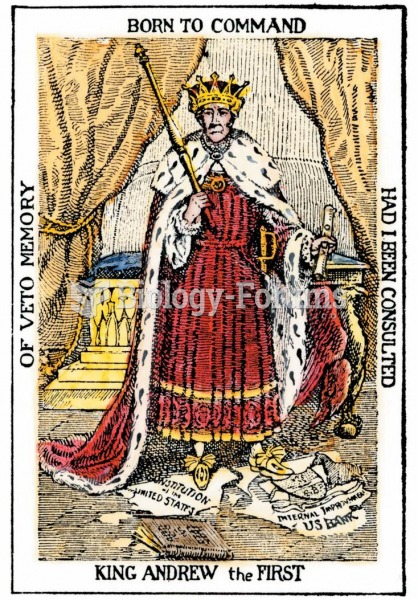 A cartoon of “King Andrew the First” shows Jackson standing atop the U.S. Constitution—a scepter in
 Find the lateral area, total surface area, and volume of the frustum
 A wave whose wavelength is 0.500 m is traveling down a 500-m long wire whose total mass is 25 ...
 Frequency distribution of phenotypes from the possible offspring in Figure 5.7. Height of the offspr
 Swimming Pool (Figure 3.1)