This topic contains a solution. Click here to go to the answer
|
|
|

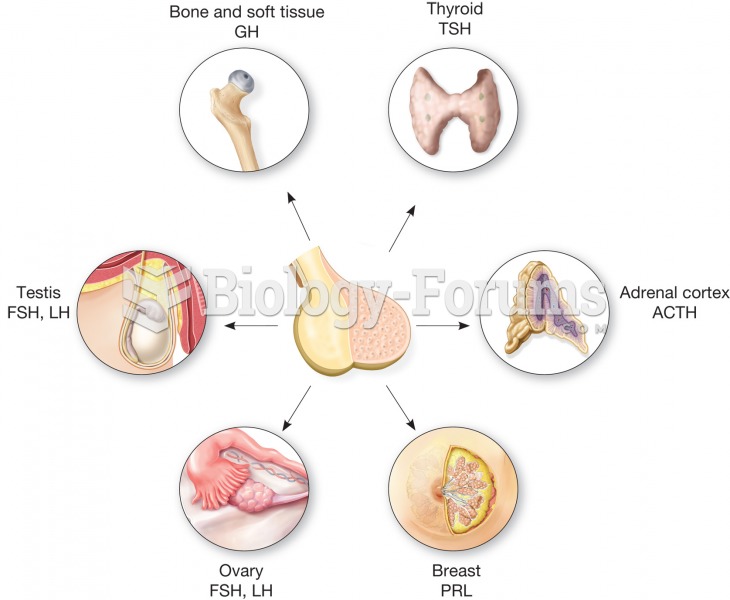 The anterior pituitary is sometimes called the master gland because it secretes many hormones that r
 Testing rapid alternating movement, palm down
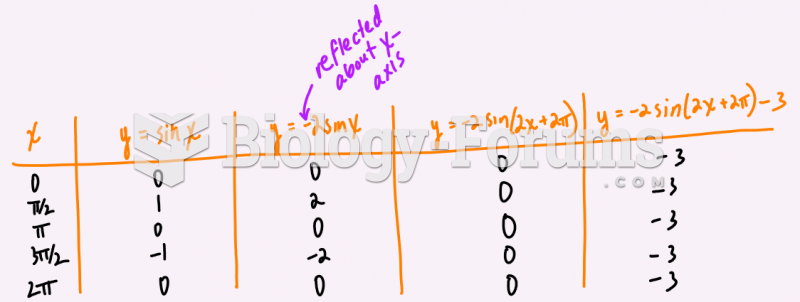 State the transformations on the function f(x)= 4sin(x-pi)-2 and then graph two cycles below.
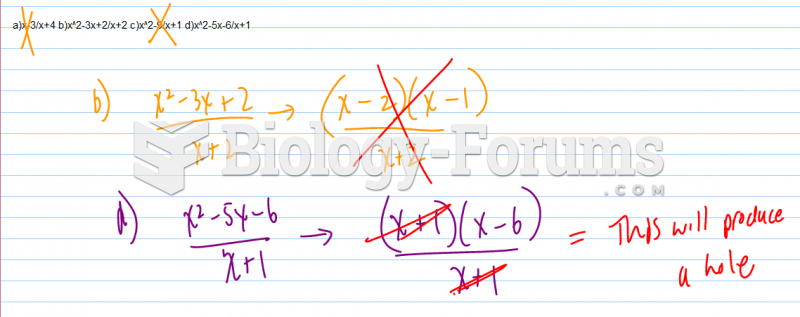 As a result of a hole in the graph, which of the following functions does not have an average ...
 essay on friendship written by a 10-year-old
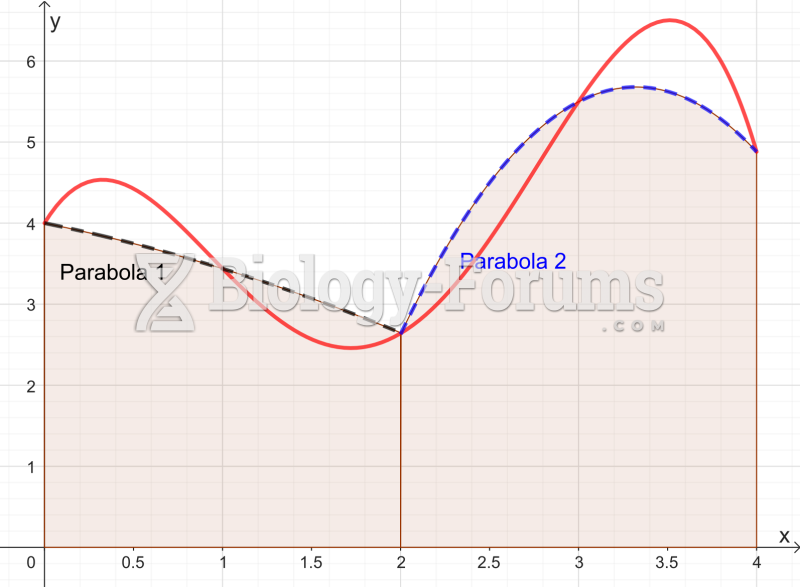 Graph approximated by two parabolas for the Simpson's rule