This topic contains a solution. Click here to go to the answer
|
|
|

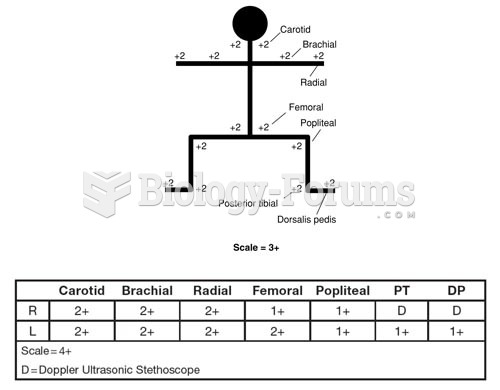 Methods to Document Peripheral Pulses A. Stick Figure Peripheral Pulse Documentation B. Tabular Peri
 Elizabeth, a married 35-year-old woman, always thought that she followed a sensible diet
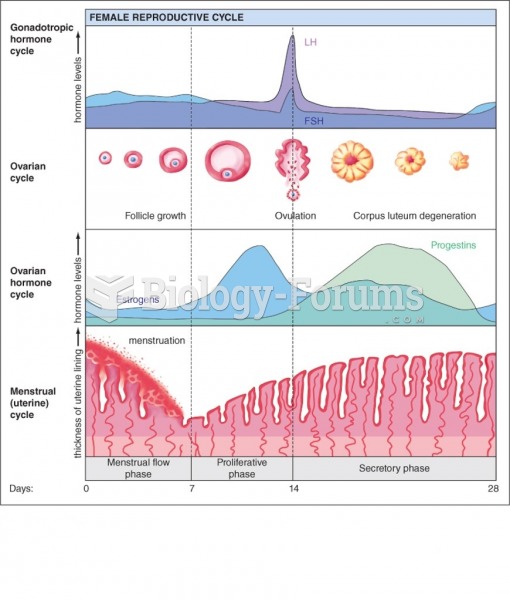 Hormonal change during ovulation and urinear cycles
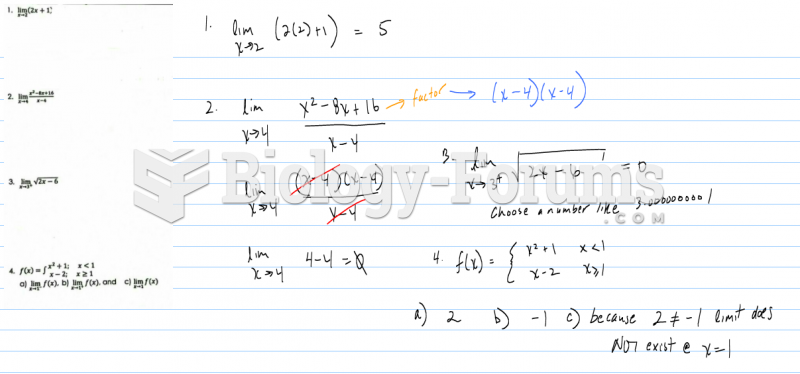 Evaluate then graph the following limits
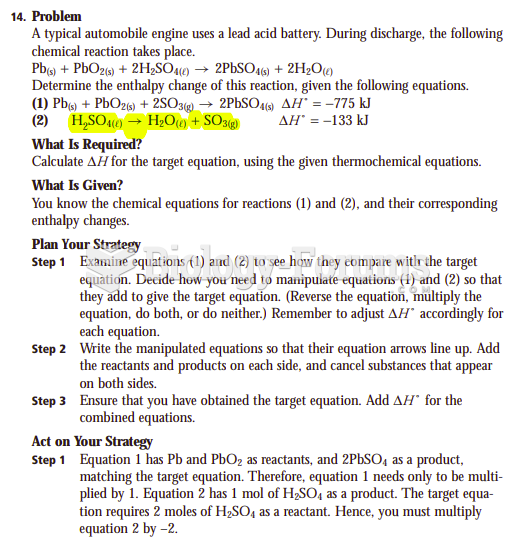 Determine the enthalpy change of this reaction
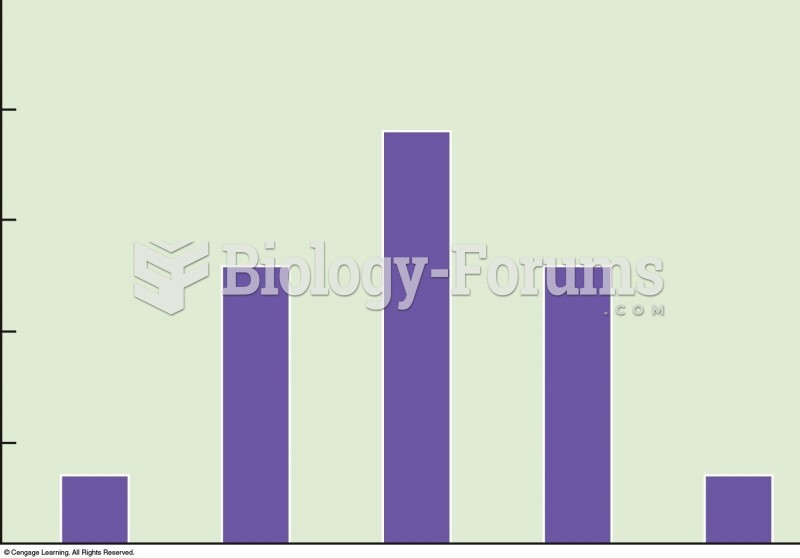 Frequency distribution of phenotypes from the possible offspring in Figure 5.7. Height of the offspr