This topic contains a solution. Click here to go to the answer
|
|
|

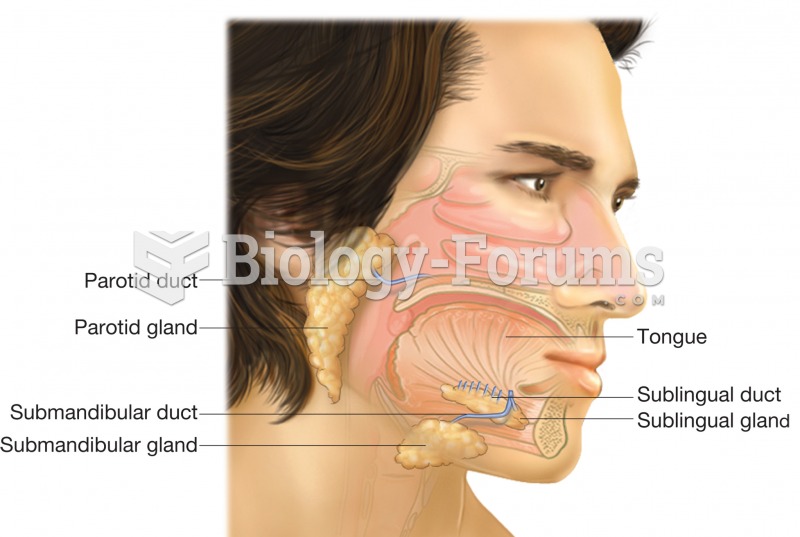 The salivary glands, parotid, sublingual, and submandibular. This image shows the position of each g
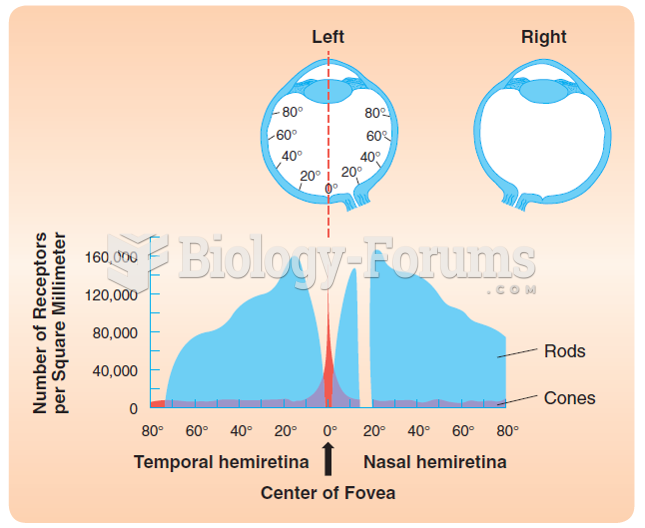 The distribution of cones and rods over the human retina. The figure illustrates the number of cones ...
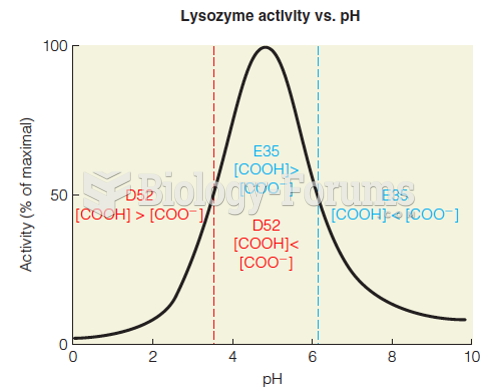 The effect of pH on the activity of lysozyme
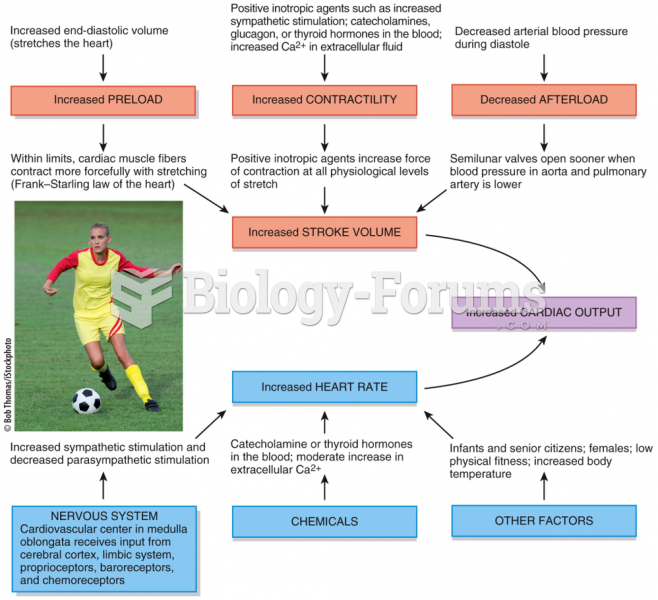 Factors that Increase Cardiac Output
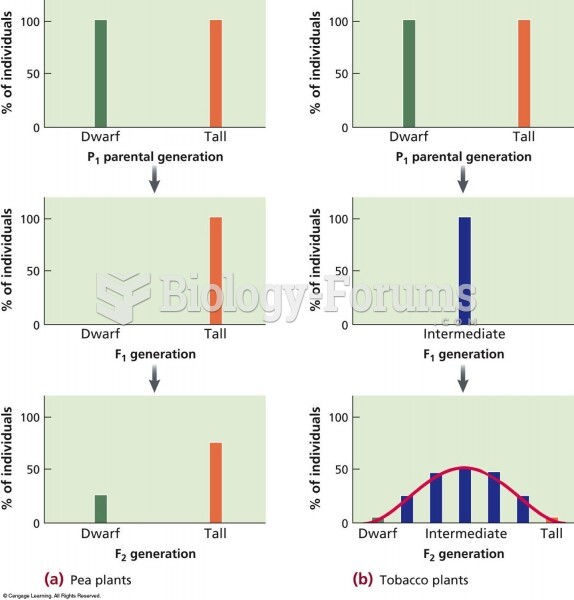 A comparison of a trait (height) that shows discontinuous and continuous phenotypes in different pla
 QTL mapping in domestic tomato