This topic contains a solution. Click here to go to the answer
|
|
|

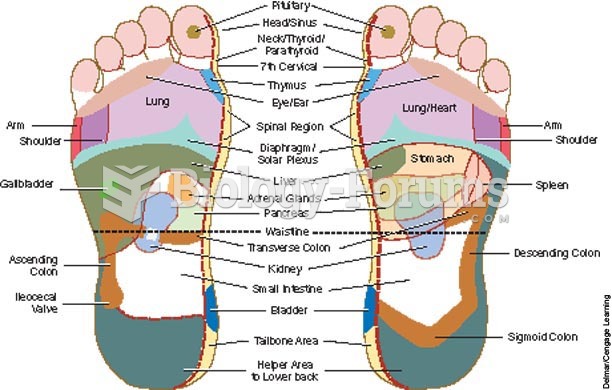 Foot reflexology chart indicates points on the foot that reflexively correspond to other areas of th
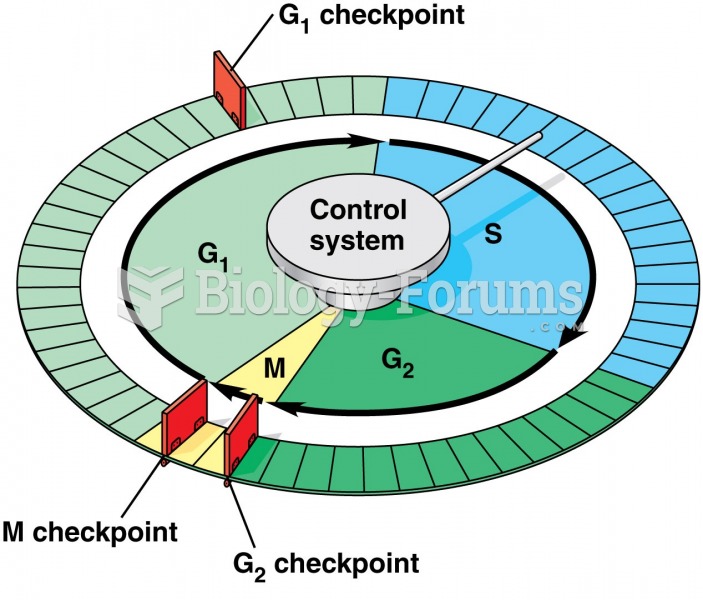 Mitosis + Check Points 2 of 5
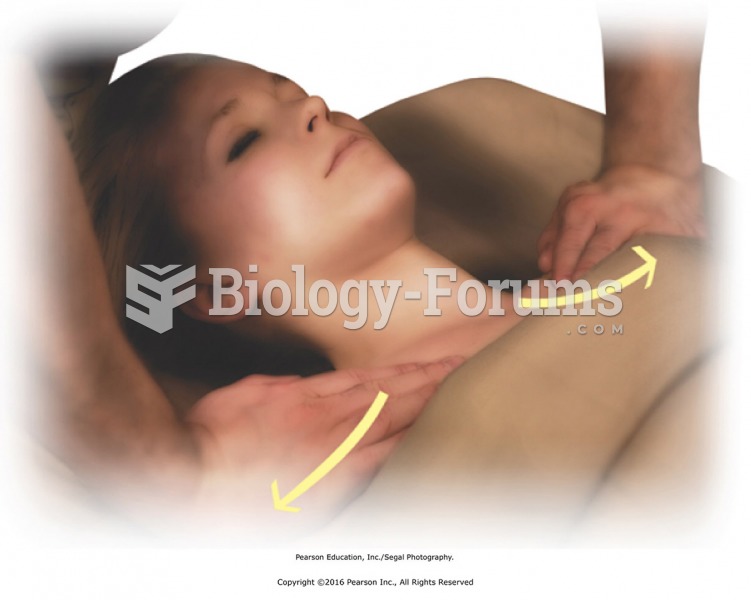 Standing at the head of the table, apply oil or lotion to chest area. Spread lubricant fanning out ...
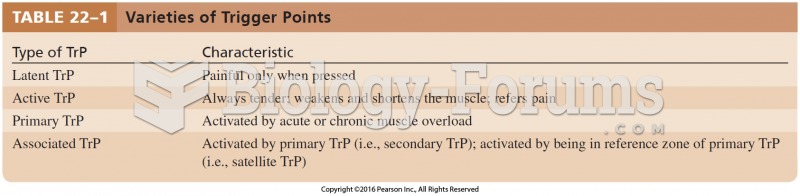 Varieties of Trigger Points
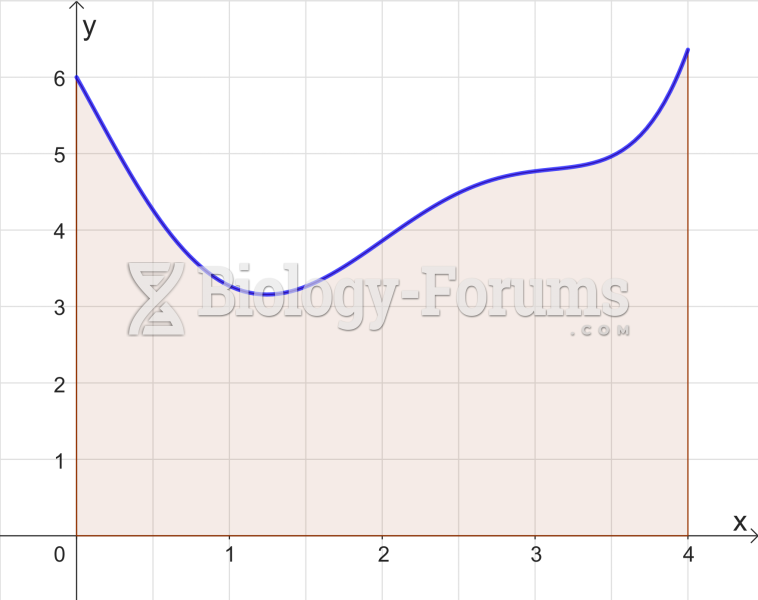 Trapezoidal Rule Graph
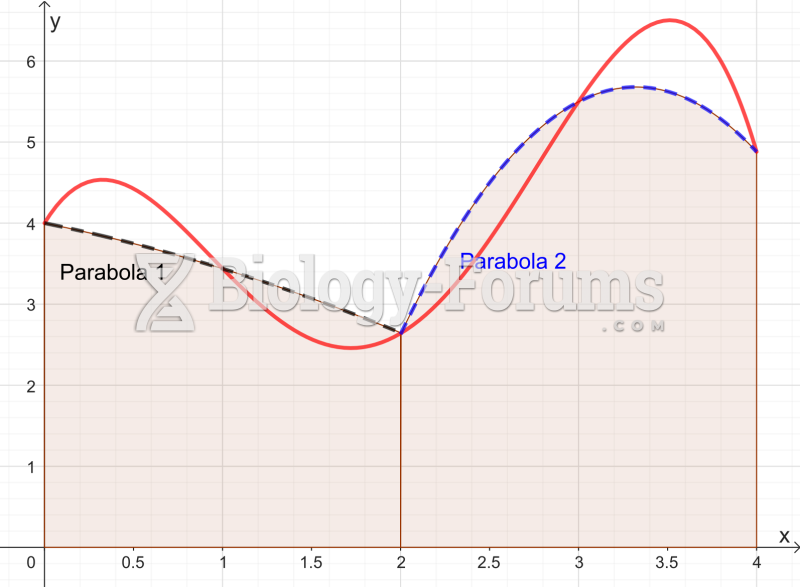 Graph approximated by two parabolas for the Simpson's rule