|
|
|

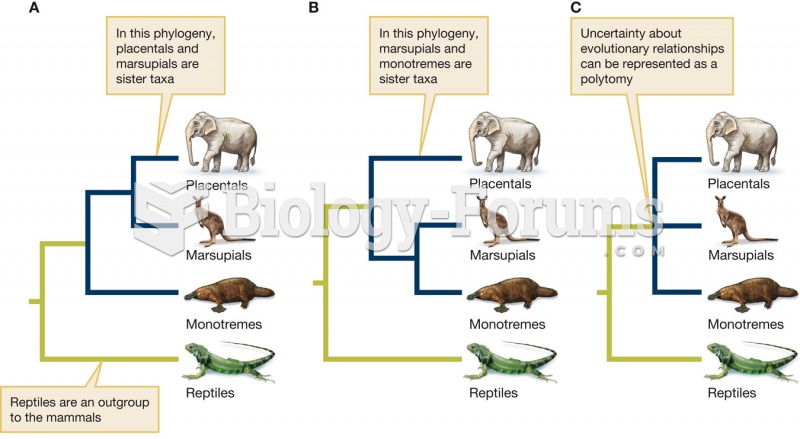 Polytomies represent uncertainty about phylogenetic relationships
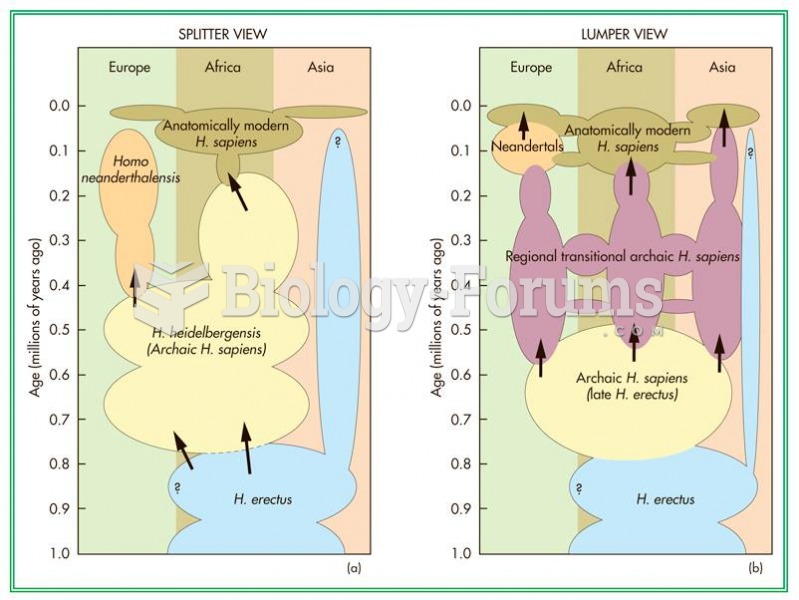 Two views of the phylogenetic relationship between Neandertals and modern H. sapiens.
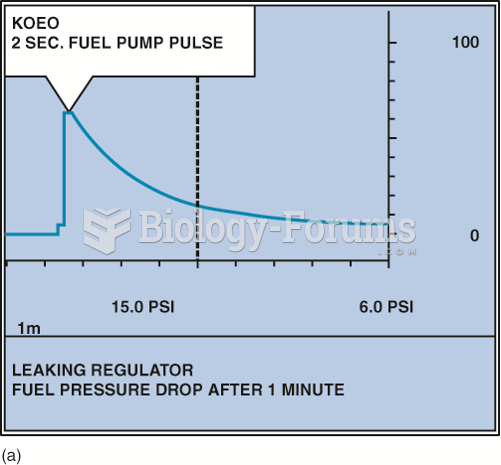 A fuel-pressure graph after key on, engine off (KOEO) on a TBI system.
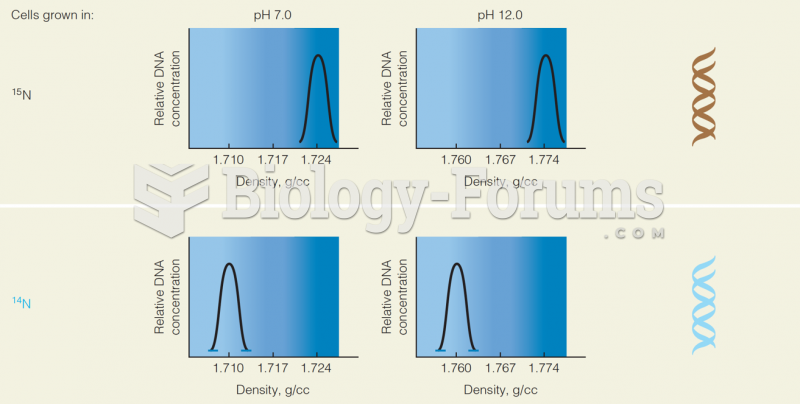 Cell Grown in 15N and 14 N: Graph of Relative DNA Concentration Vs. the Density
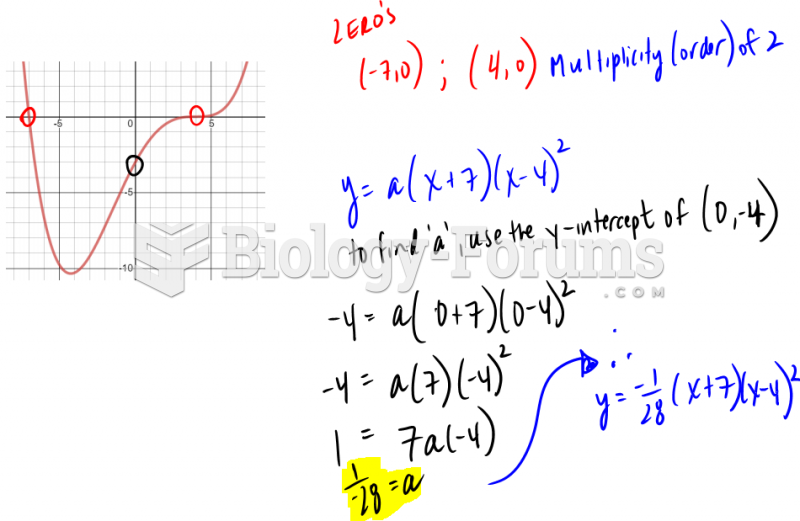 Converting cubic graph to function
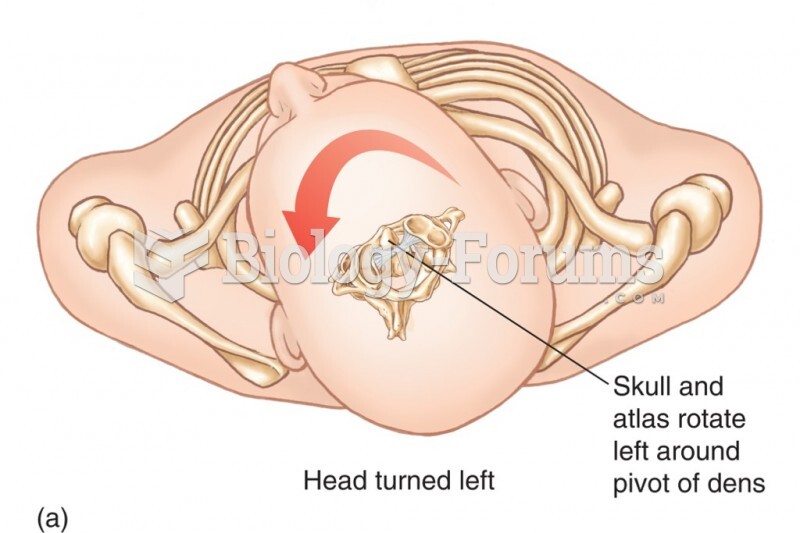 Relationship Between the Atlas and the Axis. The Dens of the Axis Provides a Pivotal Point Around Wh