|
|
|

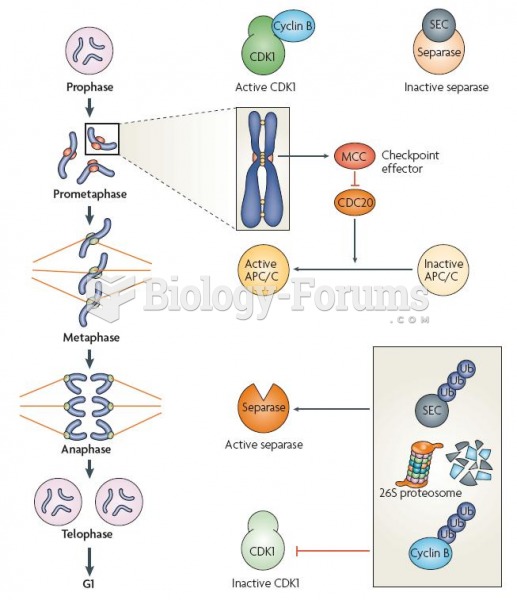 Relationship of the spindle-assembly checkpoint (SAC) with the cell-cycle machinery
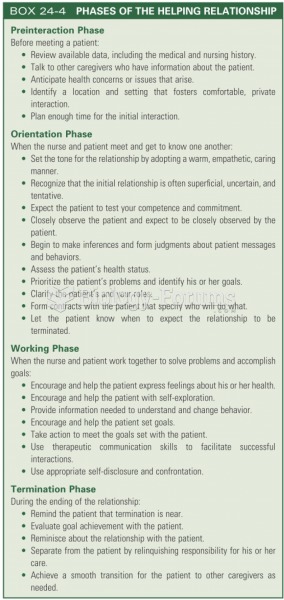 Phases of the working relationship
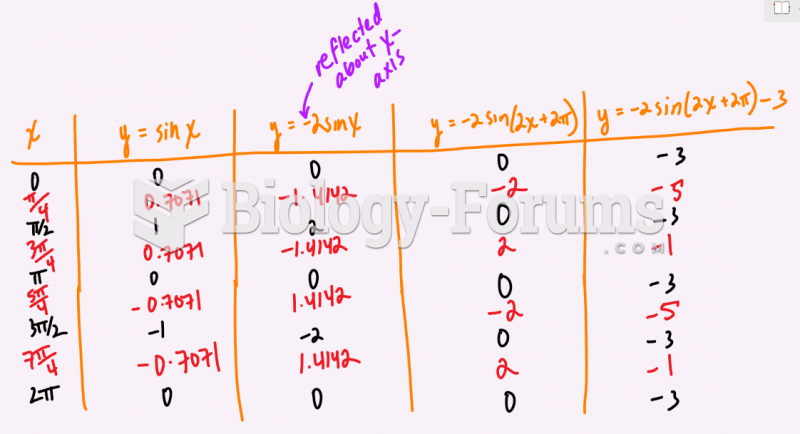 State the transformations on the function f(x)= 4sin(x-pi)-2 and then graph two cycles below.
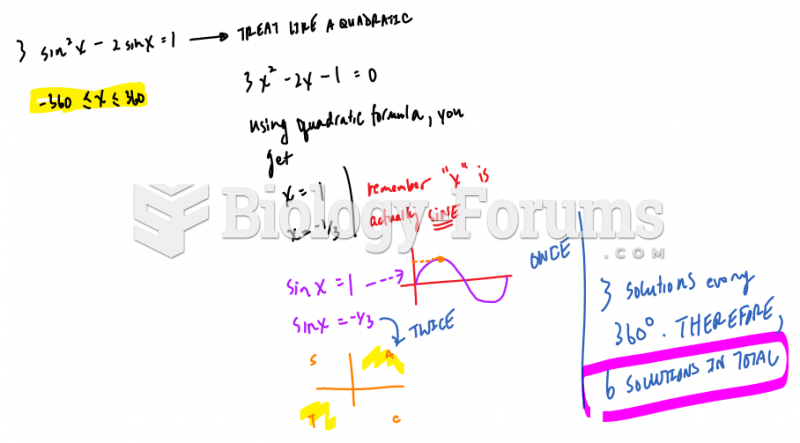 Solving graphically
 Finding the graph of a Parabola using certain values
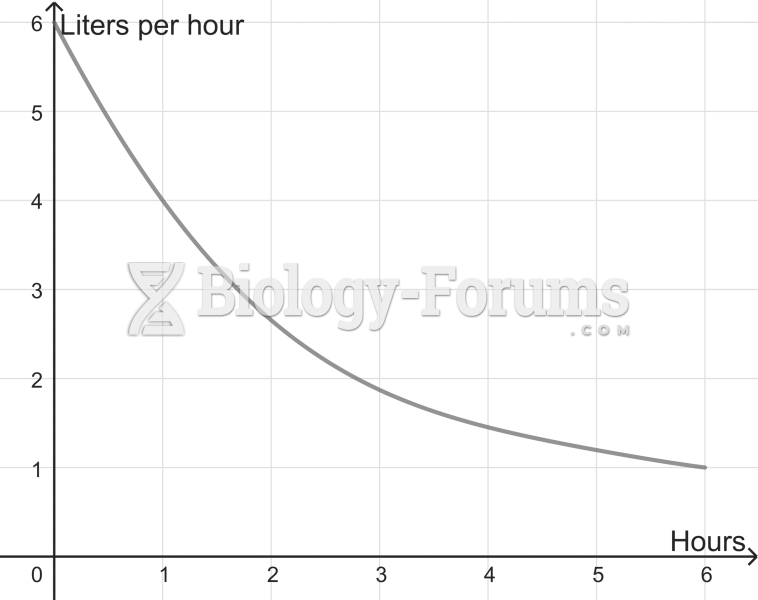 Graph Liters per Hour