|
|
|

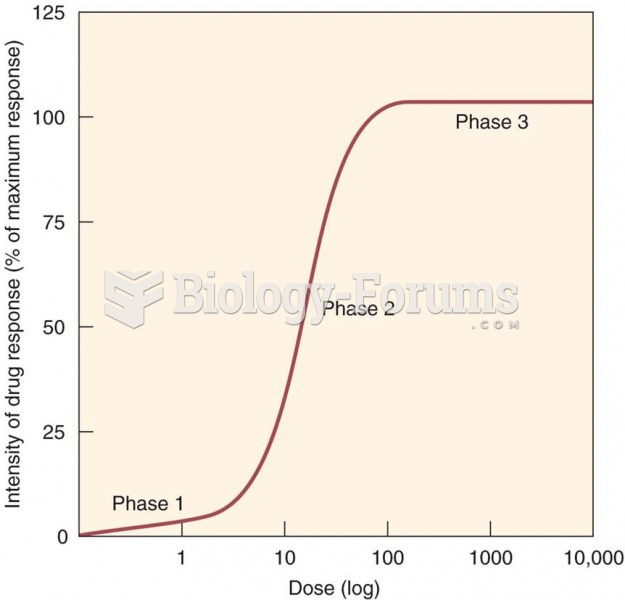 Dose–response relationship
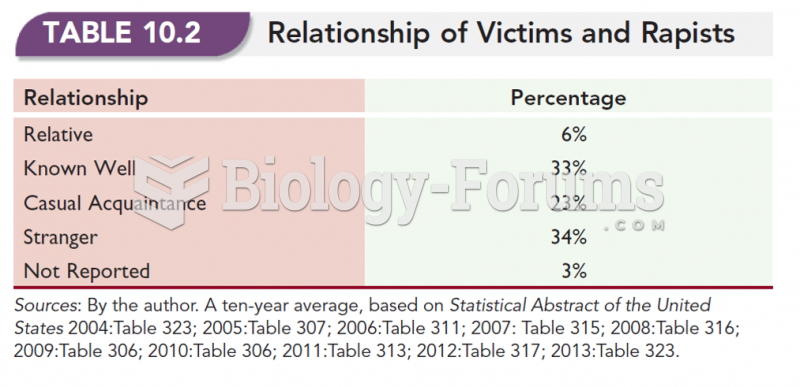 Relationship of Victims and Rapists
 How to determine if a table of values represents a linear or quadratic relationship
 Relationship between Income per Capita and Population Growth
 Graph approximated by two parabolas for the Simpson's rule
 Relationship of a DNA base sequence to peptide structure