This topic contains a solution. Click here to go to the answer
|
|
|

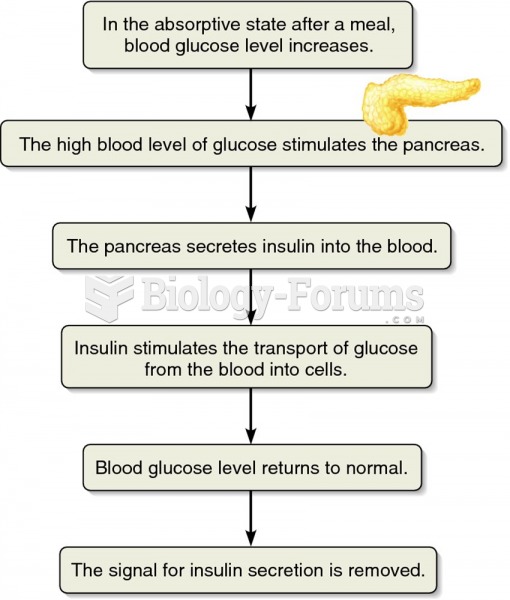 Maintenance of normal blood glucose levels.
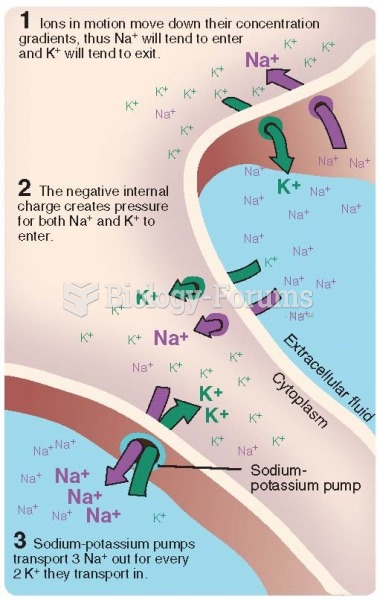 Three factors that influence the distribution of Na+ and K+ ions across the neural membrane.
 Effects of septal defects: (A) normal shunt; no cyanosis; (B) increased pressure in right ventricle; ...
 How to Graph Parametric Equations Manually
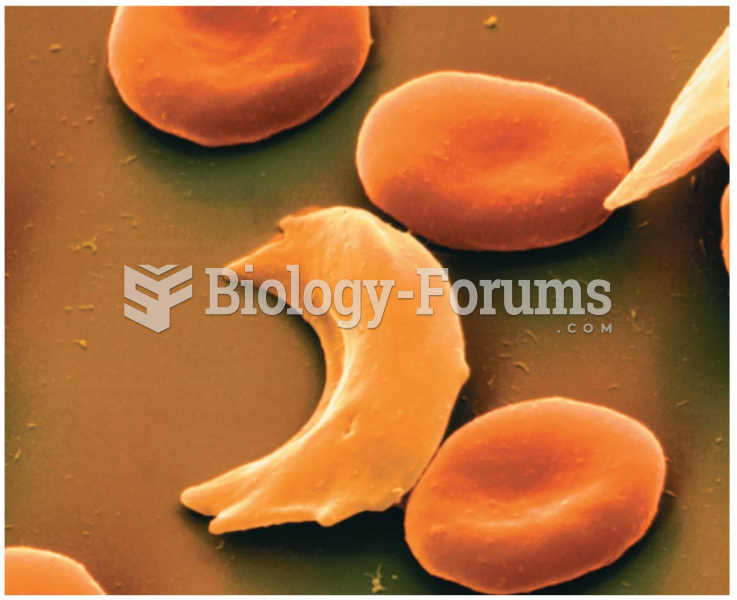 Normal red blood cells (round) and sickled red blood cells
 The obese (ob) mouse mutant, shown on the left (a normal mouse is on the right), has provided many c