This topic contains a solution. Click here to go to the answer
|
|
|

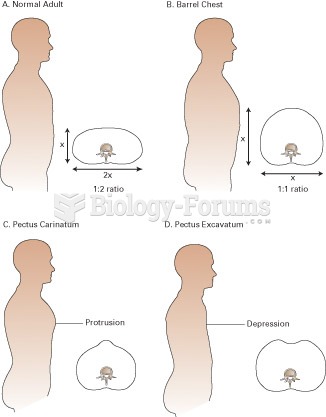 Chest Configurations, Normal Adult, Barrel Chest, Pectus Carinatum, Pectus Excavatum
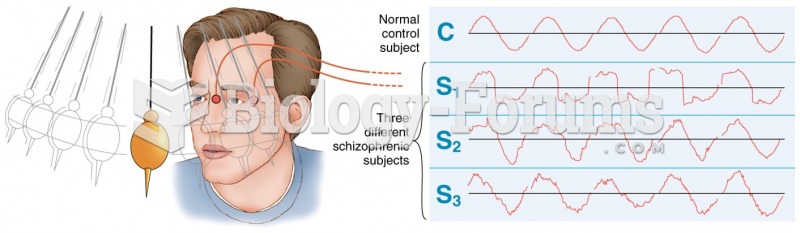 Visual tracking of a pendulum by a normal control subject (top) and three schizophrenics. (Adapted ...
 Variable Gases: Methane
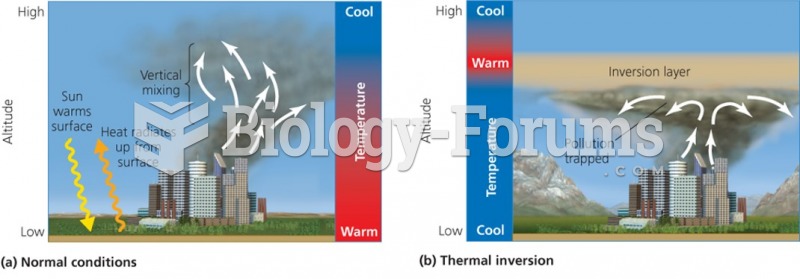 Normal and thermal inversion air masses interaction
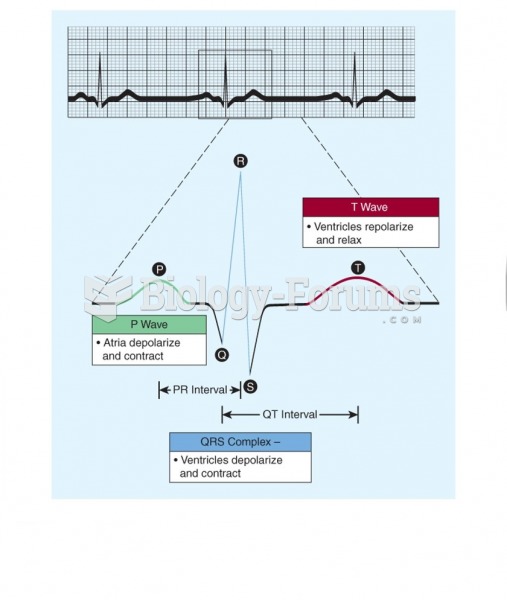 Normal electrocardiogram tracing
 Normal rainfall has a concentration of OH- that is 3.99 × 10⁻⁹. The concentration of H3O+ in ...