In Figure 11.1, an increase in the marginal propensity to save is represented by a change in the consumption function from
A) C1 to C3. B) C3 to C1. C) C2 to C1. D) C1 to C2.
Question 2
One key implication of rational expectations is that
A) anticipated monetary policy has no effect on the rate of unemployment or the level of real GDP.
B) unanticipated monetary policy has no effect on the economy but anticipated monetary policy does have an effect on the economy.
C) anticipated monetary policy can affect the rate of unemployment but not the level of real GDP.
D) both unanticipated monetary policy and anticipated monetary policy have an effect on the economy.

 Cloning may help save endangered species.
 Laboratory mice demonstrate that genetic differences can have profound effects on the propensity to
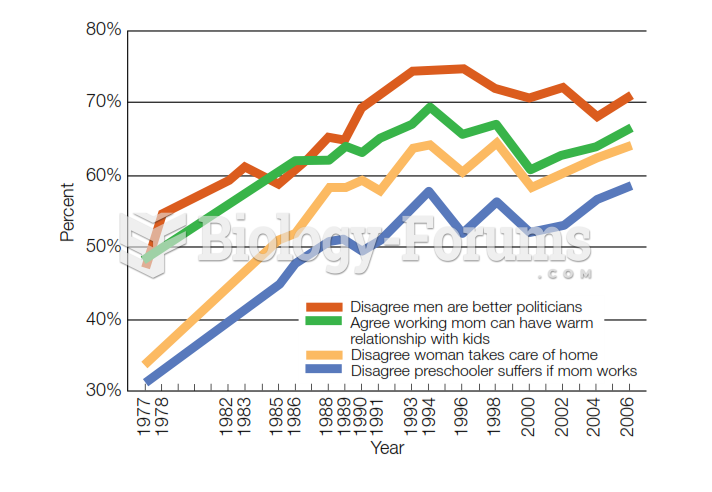 Change in American Gender Attitudes, 1977-2006 Over recent decades, views of gender roles have beco
 Mean scores for Erikson’s stage V (Identity) for two cohorts. Scores for both cohorts increase ...
 Demographic change and the effect on people social, and economic life
 Climate change occurs over millions of years