|
|
|

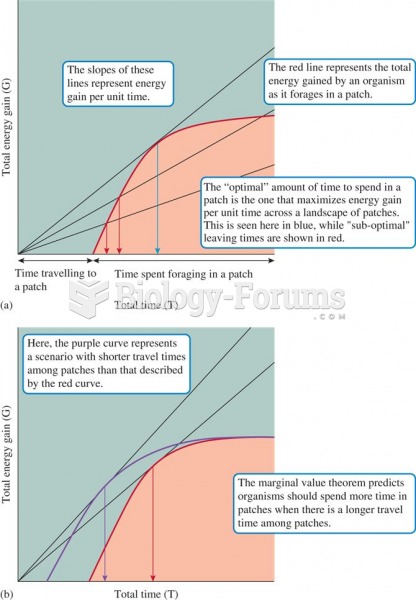 A graphical representation of the marginal value theorem.
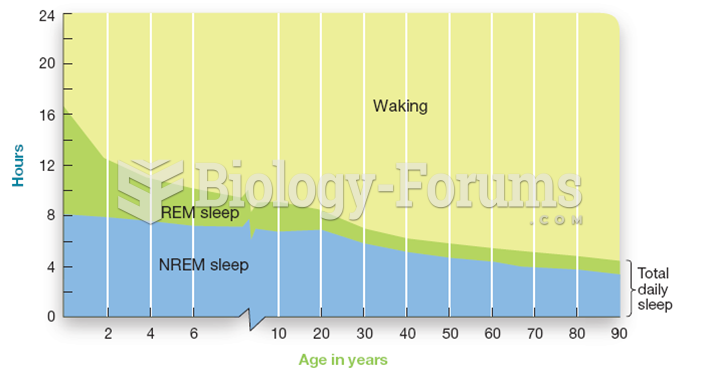 Sleep Requirements Change with Age
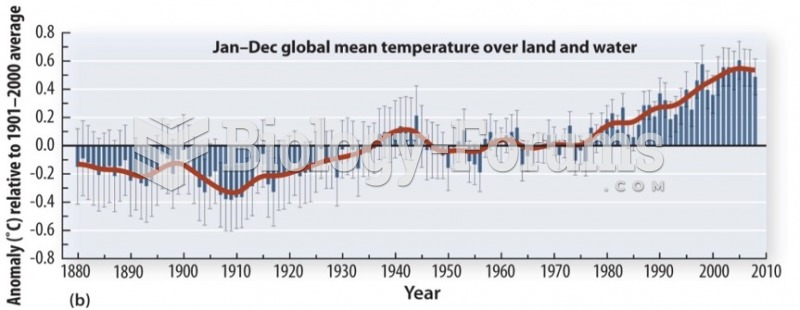 Global Climate Change
 The ability of a community to cope, adapt to, and mitigate the accelerating impact of climate change
 Movement of Nutrients
 (left) Urine sample from an unaffected person does not change color upon exposure to air. (right) Ur