|
|
|

 Donald Trump and Climate Change
 Climate Change
 Use a rubber or padded barrier to save wear and tear on the tabletop.
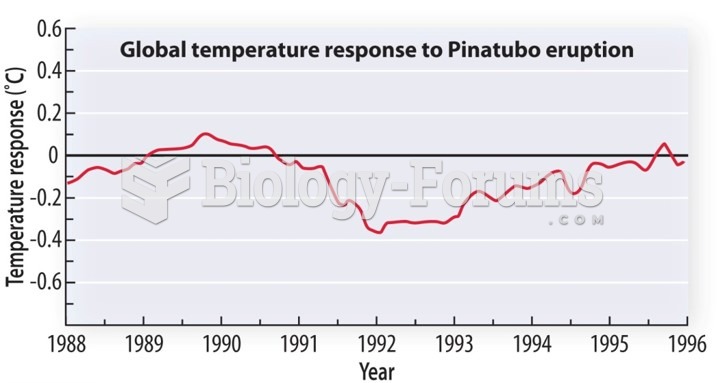 Climate Change: Volcanoes Timescale
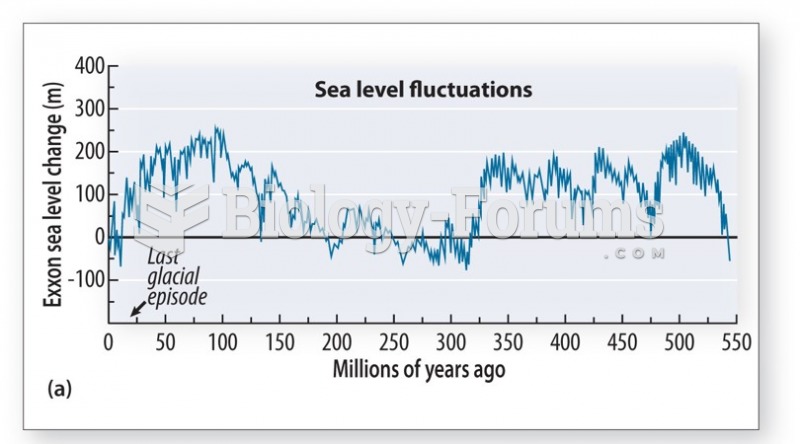 Normal change in sea level
 Sternocleidomastoid muscle movement