|
|
|

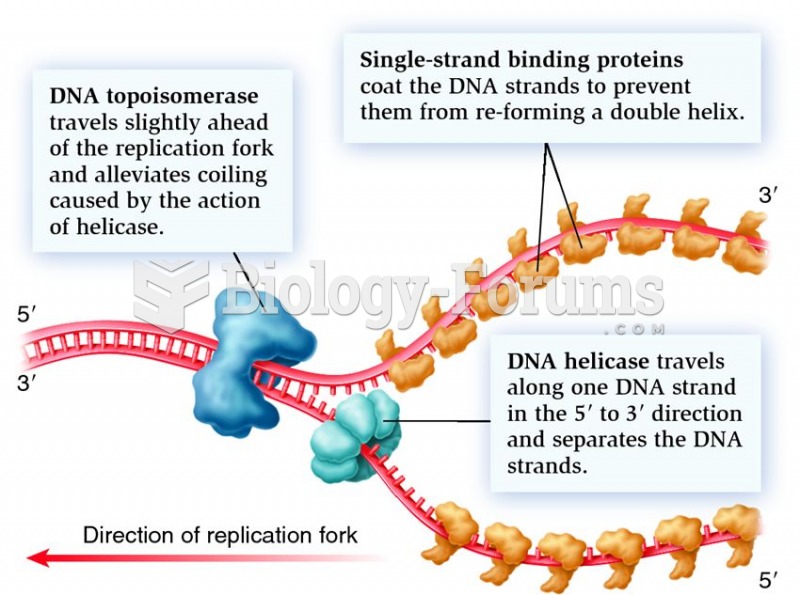 Proteins that facilitate the formation and movement of a replication fork
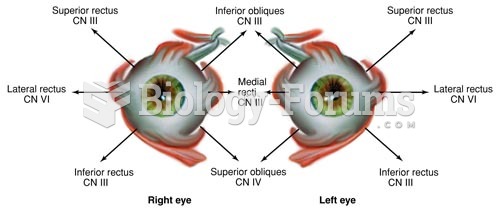 Direction of Movement of Extraocular Muscles
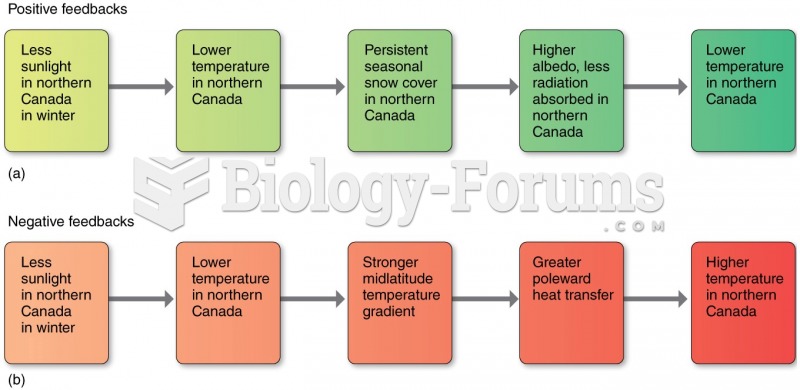 Defining Climate Change
 Climate Change
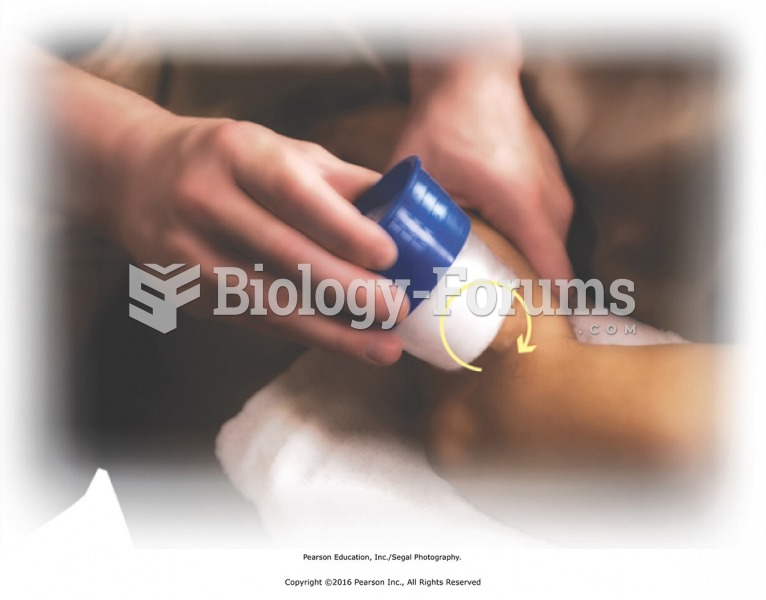 Circular movement of ice over lateral area just distal to the elbow. Use medium pressure to apply ...
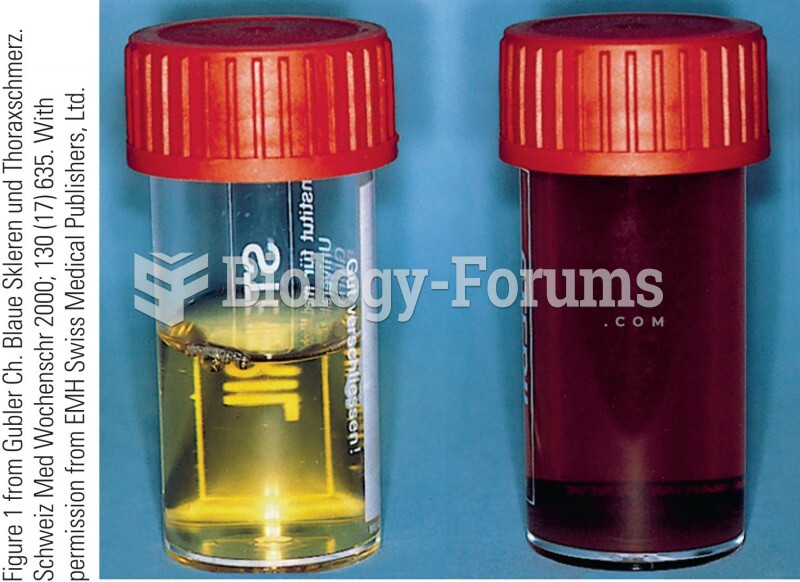 (left) Urine sample from an unaffected person does not change color upon exposure to air. (right) Ur