Answer to Question 1
1 . Data preparation involves logging the data in; making a codebook; entering the data into the computer; checking the data for accuracy; transforming the data; and, developing and documenting a database that integrates all of your measures.
2 . Descriptive statistics describe the basic features of the data in a study. They provide meaningful summaries about the sample so that potential patterns might emerge from the data. Together with graphical analysis, they form the basis of virtually every form of quantitative analysis. With descriptive statistics, you are simply describing what the data show. Following the discussion of conclusion validity, you will learn about the basics of descriptive analysis in the rest of the chapter. Often, the descriptive statistics produced early on are voluminous because we first need to examine each variable individually. We need to know what the distributions of numbers look like, whether we have issues to deal with like extremely large or small values (outliers), and whether we have problems with missing data. The first step is usually a descriptive summary of characteristics of your sample. Then you move on to describing the basic characteristics of your study variables (the measures). You carefully select and organize these statistics into summary tables and graphs that show only the most relevant or important information. This is especially critical so that you don't miss the forest for the trees.. If you present too much detail, the reader may not be able to follow the central line of the results. More extensive analysis details are appropriately relegated to appendicesreserving only the most critical analysis summaries for the body of the report itself.
3 . Inferential statistical analysis tests your specific research hypotheses. In descriptive and some relational studies, you may find that simple descriptive summaries like means, standard deviations, and correlations provide you with all of the information you need to answer your research question. In experimental and quasi-experimental designs, you will need to use more complex methods to determine whether the program or treatment has a statistically detectable effect.
Answer to Question 2
B

 Children with attention deficit disorder with hyperactivity (ADHD) diagnoses typically need a quiet, ...
 VITROS DT60II automated blood analysis system.
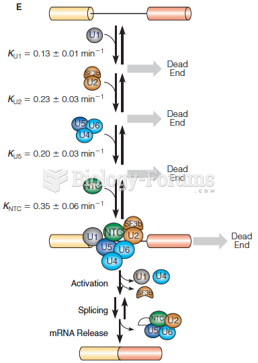 Kinetic analysis of spliceosome assembly
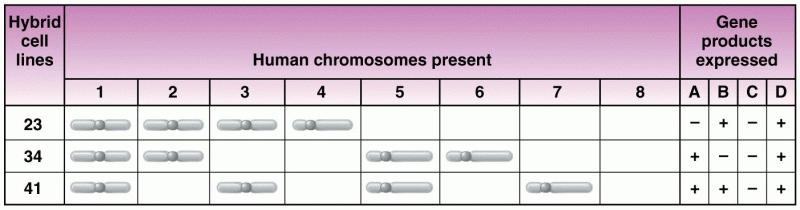 A hypothetical grid of data used in synteny testing
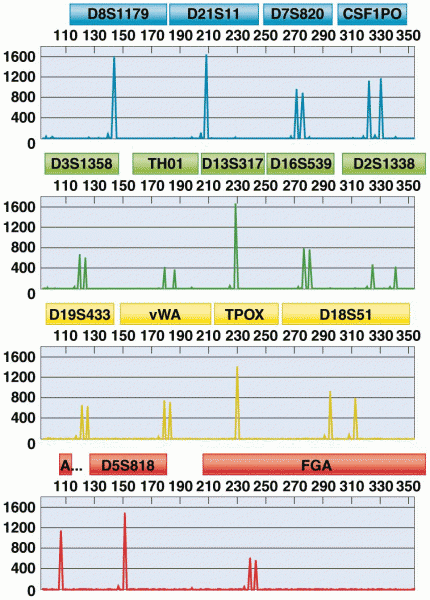 An electropherogram showing the results of a DNA profile analysis
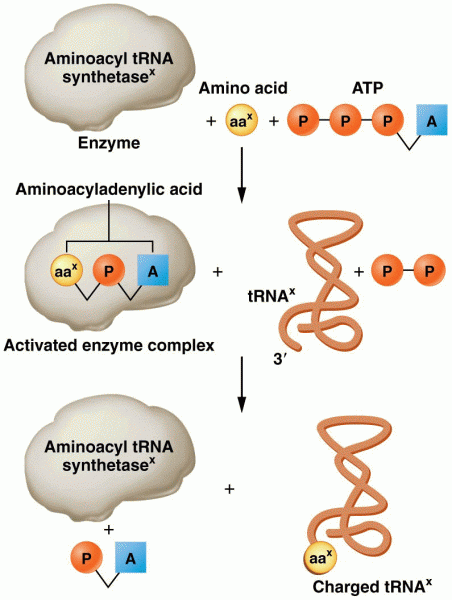 Steps involved in charging tRNA