This topic contains a solution. Click here to go to the answer
|
|
|

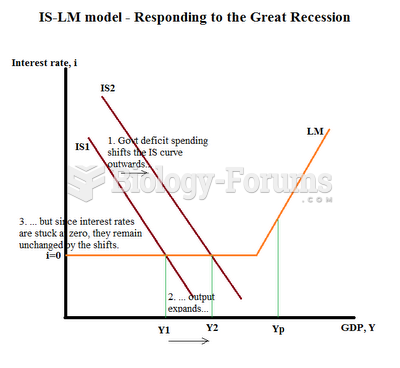 The Keynesian IS/LM Model
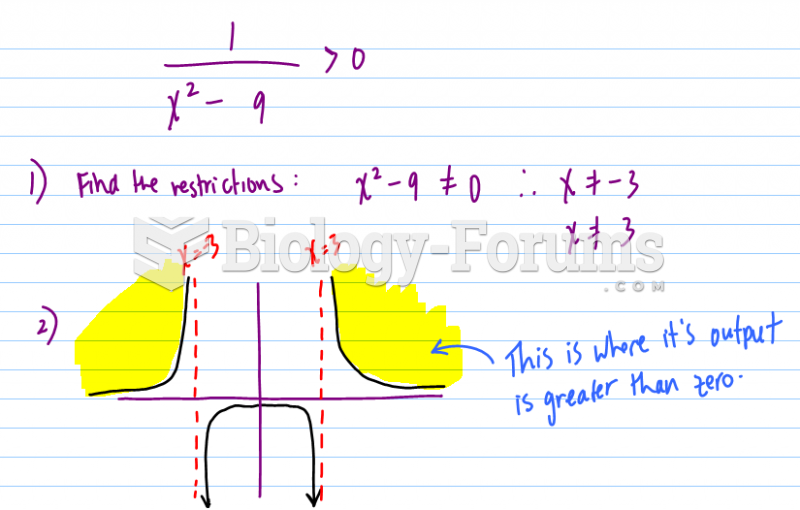 To satisfy the inequality, sketch the following function by hand and shade the graph regions.
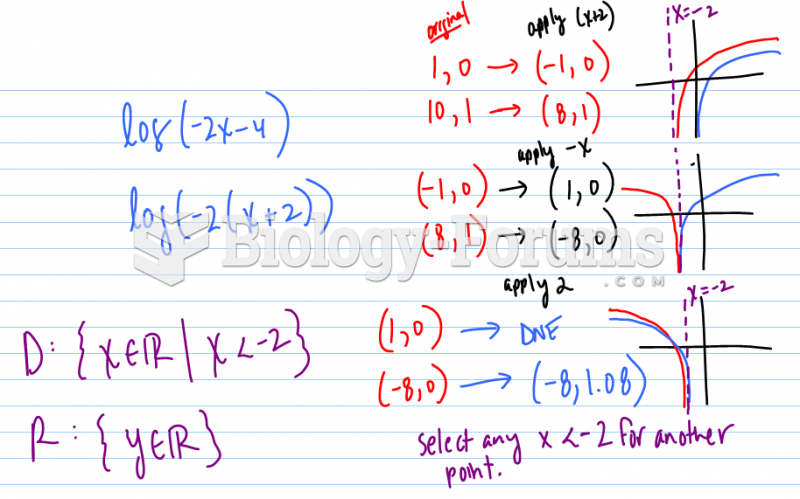 Sketch the graph of each function using transformations. State the domain and range.
 graph
graph
 calculus homework graph help please
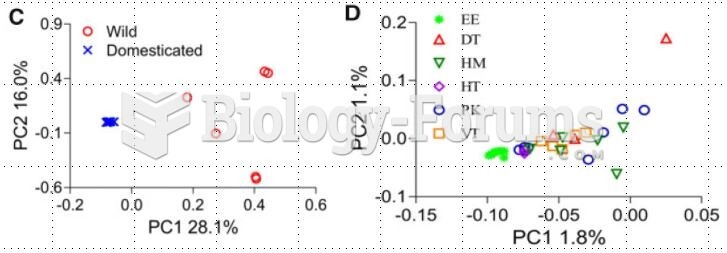
 Aggregate Fruits: Blackberry