This topic contains a solution. Click here to go to the answer
|
|
|

 Positive velocity graph
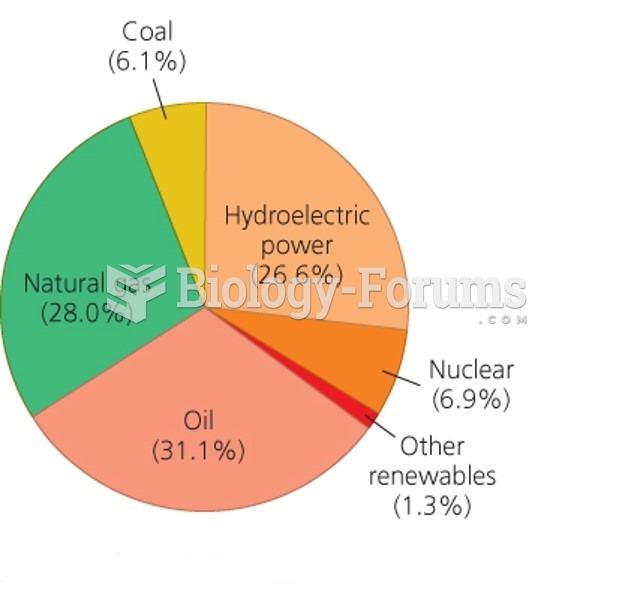 Canada Total Energy Consumption by Fuel Type
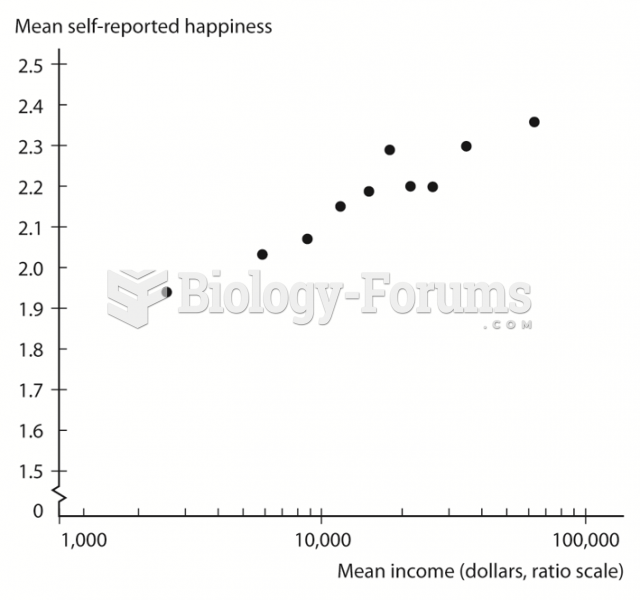 Relationship between Income and Happiness in the United States
 Sketch a graph of the function h(x), by hand on the following interval:
 graph
graph
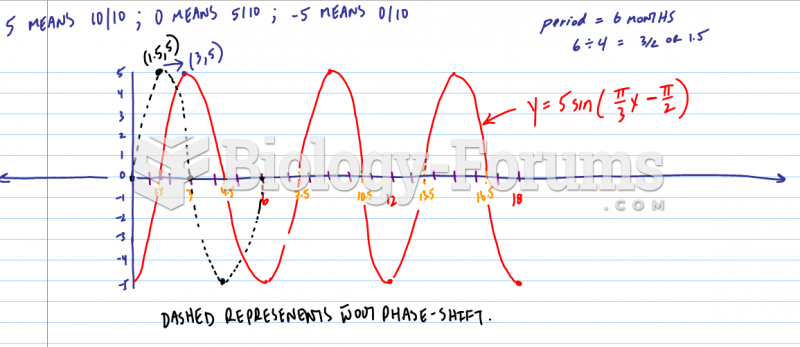
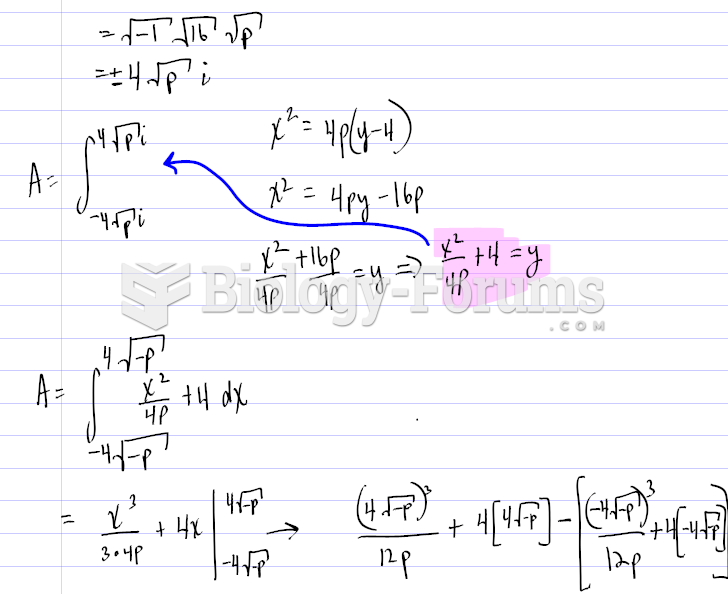 Finding the graph of a Parabola using certain values