This topic contains a solution. Click here to go to the answer
|
|
|

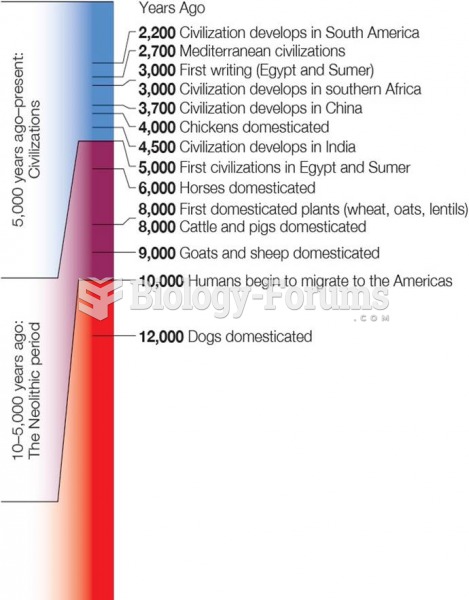 Time Line of Human History From Upper Paleolithic Period to the Present
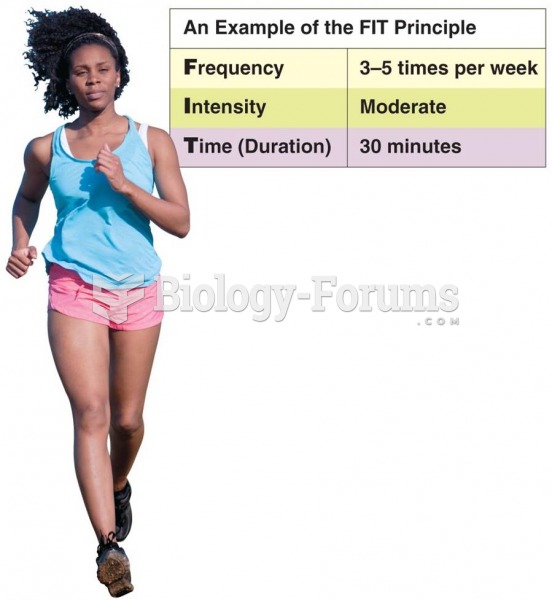 The Workout (Primary Conditioning Period)
 Mogao Caves (Caves of a Thousand Buddhas) Dunhuang, China.
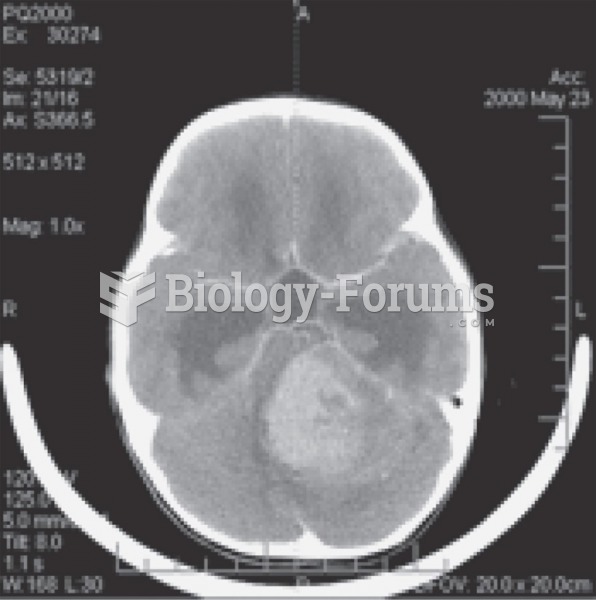 CT imaging of glioblastoma in a 6-year-old girl.
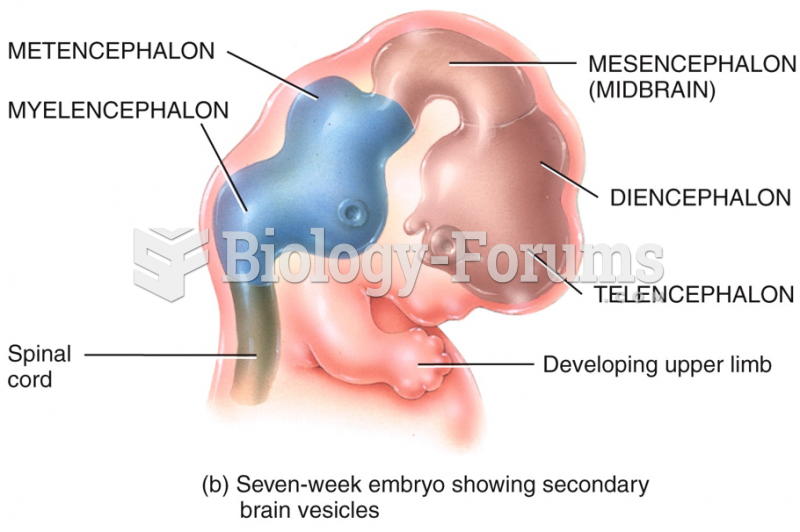 Embryonic Period
 essay on friendship written by a 10-year-old