This topic contains a solution. Click here to go to the answer
|
|
|

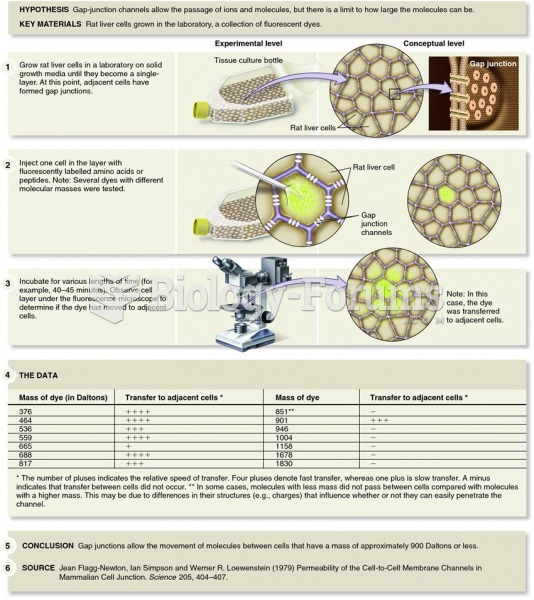 Use of fluorescent molecules by Lowenstein and colleagues to determine the size of gap-junction chan
 On March 25, 1911, as scores of young factory girls leaped to their deaths from the eighth, ninth, a
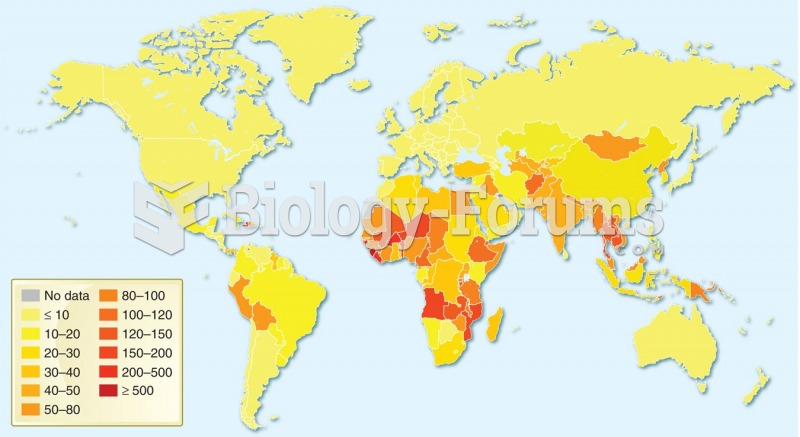 Age-standardized disability-adjusted life year (DALY) rates from hepatitis B by country (per 100 000 ...
 Embryonic Period
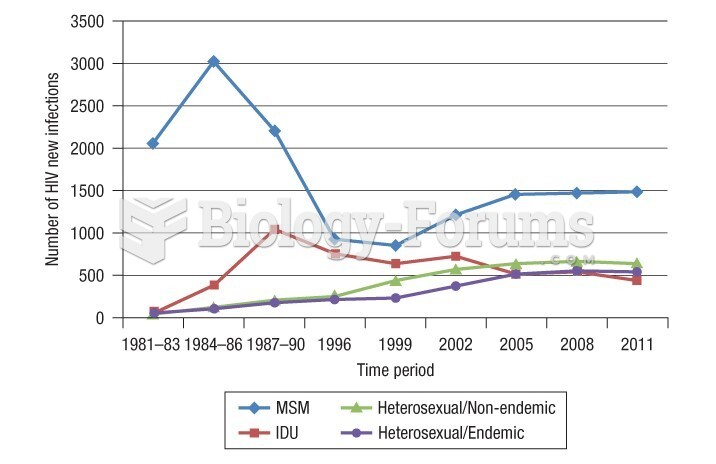 Estimated number of new HIV infections per year over time period in Canada
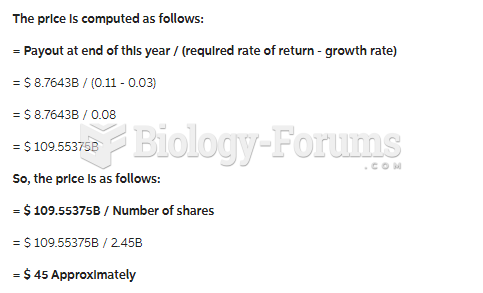 Analysts expect Virtucon to make payouts of $8.7643B at the end of this year. Assume that all ...