The following graph resulted when a researcher plotted the paired scores from two sets of data: Which of the following conclusions is justified from an examination of the graph?
a. The coefficient of correlation is close to .50.
b. The correlation between X and Y is negative and low.
c. The correlation between X and Y is positive and high.
d. A Spearman rho coefficient of correlation is appropriate for these data.
e. A Pearson's coefficient of correlation is not appropriate for these data.
Question 2
If a relationship between two variables is spurious, we conclude that it is
a. nearly always a cause and effect relationship.
b. partially regressed.
c. accounted for by another extraneous variable
d. not a statistically significant relationship.
e.

 Dimensions for gathering data
 Grace Service, a YMCA missionary, explained that these porters worked at the base of Mount Omei in S
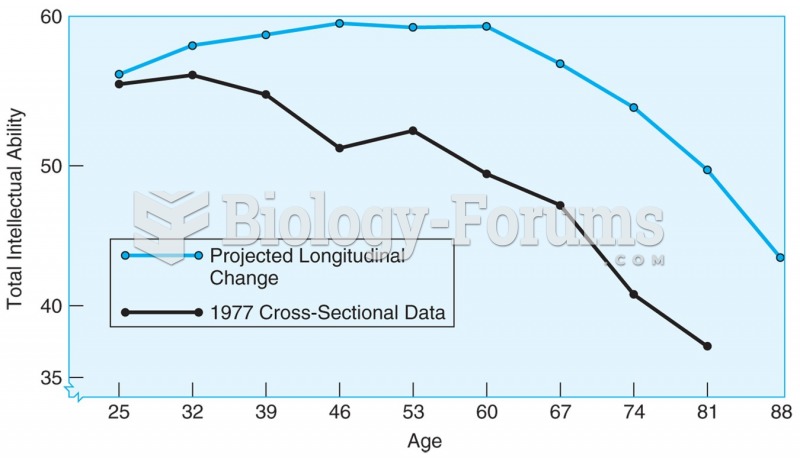 4.1 Age changes in total IQ based on cross-sectional data (lower line) and longitudinal data ...
 A model of the 70S ribosome based upon early structural data
 graph
graph
 A hypothetical grid of data used in synteny testing