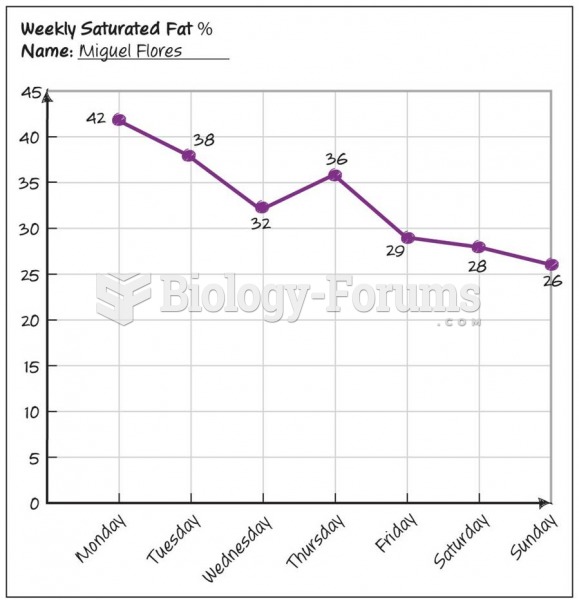
Author Question: The following graph resulted when a researcher plotted the paired scores from two sets of data: ... (Read 151 times)

corkyiscool3328

  • Hero Member
  • *****
  • Posts: 539
The following graph resulted when a researcher plotted the paired scores from two sets of data: Which of the following conclusions is justified from an examination of the graph?
 
  a. The coefficient of correlation is close to .50.
  b. The correlation between X and Y is negative and low.
  c. The correlation between X and Y is positive and high.
  d. A Spearman rho coefficient of correlation is appropriate for these data.
  e. A Pearson's coefficient of correlation is not appropriate for these data.

Question 2

If a relationship between two variables is spurious, we conclude that it is
 
  a. nearly always a cause and effect relationship.
  b. partially regressed.
  c. accounted for by another extraneous variable
  d. not a statistically significant relationship.
  e.


lauravaras

  • Sr. Member
  • ****
  • Posts: 347
Answer to Question 1

E

Answer to Question 2

C


Related Topics

Need homework help now?

Ask unlimited questions for free

Ask a Question
 

Did you know?

Certain topical medications such as clotrimazole and betamethasone are not approved for use in children younger than 12 years of age. They must be used very cautiously, as directed by a doctor, to treat any child. Children have a much greater response to topical steroid medications.

Did you know?

Aspirin is the most widely used drug in the world. It has even been recognized as such by the Guinness Book of World Records.

Did you know?

It is difficult to obtain enough calcium without consuming milk or other dairy foods.

Did you know?

More than nineteen million Americans carry the factor V gene that causes blood clots, pulmonary embolism, and heart disease.

Did you know?

Bacteria have flourished on the earth for over three billion years. They were the first life forms on the planet.

For a complete list of videos, visit our video library