Refer to Exhibit 7-13. The expected frequency for above-average students who want to attend college is
a. 15.
c. 25.
b. 20.
d. 35.
Question 2
What is the relationship between the standard deviation of a population and the standard deviation of means of samples randomly selected from the population?
a. The standard deviation of the distribution of sample means is larger than that of the population.
b. The standard deviation of the population is larger than that of the distribution of sample means.
c. They are equal to one another.
d. It is impossible to determine the relationship with the available data.

 Intradermal drug administration: (b) the administration site is prepped Source: Pearson Education/PH
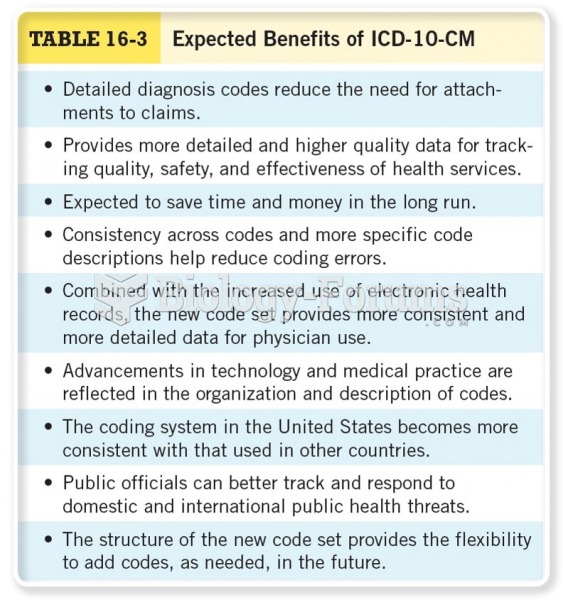 Expected Benefits for ICD-10-CM
 Average Annual Growth Rates of Population by Country Group
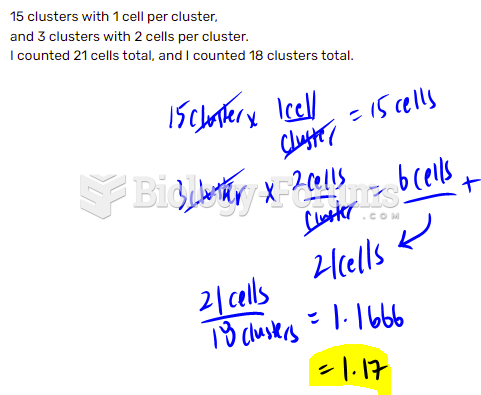 What would your average (mean) number of cells per cluster be?
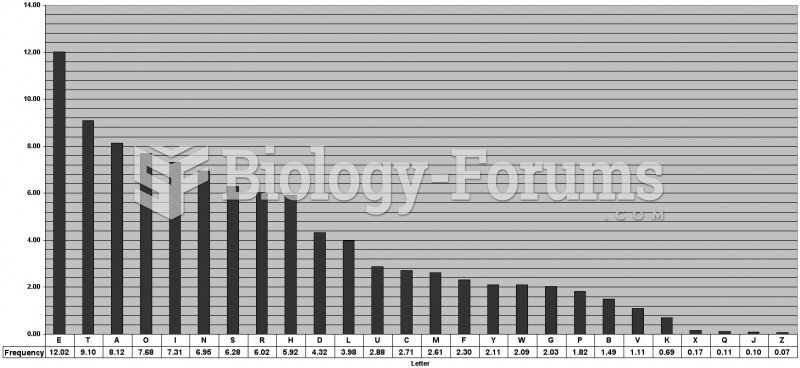 Letter Frequency Table
 Students working around a computer