Refer to Exhibit 7-13. The expected frequency for above-average students who want to attend college is
a. 15.
c. 25.
b. 20.
d. 35.
Question 2
What is the relationship between the standard deviation of a population and the standard deviation of means of samples randomly selected from the population?
a. The standard deviation of the distribution of sample means is larger than that of the population.
b. The standard deviation of the population is larger than that of the distribution of sample means.
c. They are equal to one another.
d. It is impossible to determine the relationship with the available data.

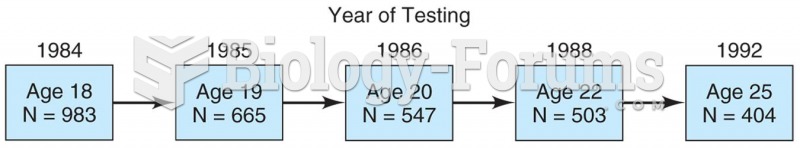 Model of a longitudinal study in which 983 students were surveyed in 1984 and then again in 1985, 19
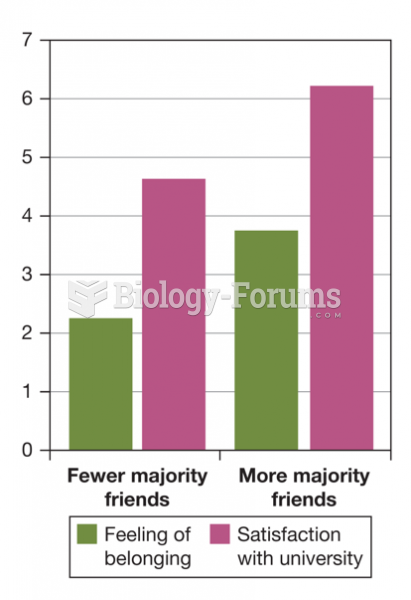 The Impact of Cross-Ethnic Friendships on Minority Students’ Well-Being
 College and university attendance is associated with developmental advances
 The temperature of an average lightning bolt is 3.0 x 10⁴ °C. What is the equiva
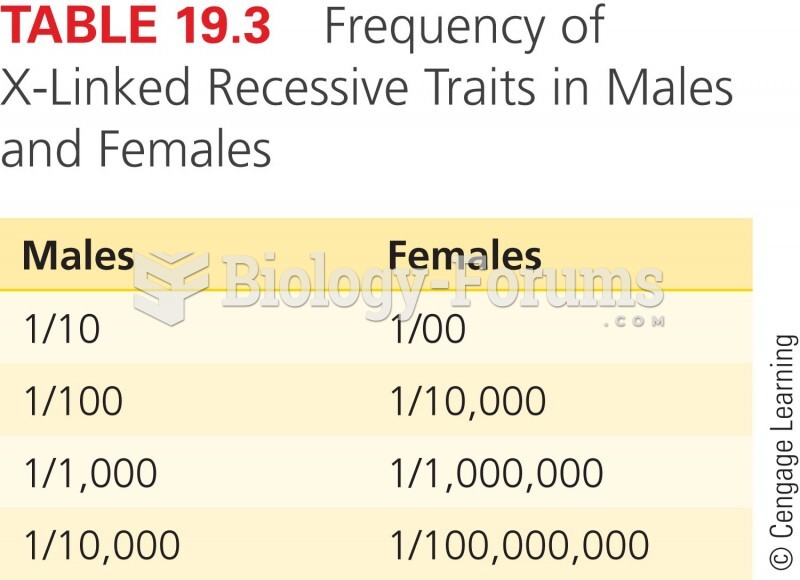 Frequency of X-Linked Recessive Traits in Males and Females
 The two species of cichlids in Lake Apoyo exhibit distinctive morphologies