Answer to Question 1
Student answers will vary. E.g. A TPS focusing on production and manufacturing to keep production costs low while maintaining quality, and for communicating with other possible vendors. The TPS would later be used to feed MIS and other higher level systems.
Answer to Question 2
Choosing key performance indicators that are most important to the organization and the person using the dashboard is the most important success factor. Dashboards make data look good, but the charts and graphs are only as useful as the quality of the underlying data. Users should ask for warnings when data is stale or not altogether reliable. The dashboard should be updated as often as needed for the user's situation-daily, hourly, or minute by minute, if necessary. In order to avoid information overload, seven or fewer graphs, charts, maps, or tables should be used on one dashboard. Another key in designing a dashboard is to keep tables and charts simple, as well as to avoid 3D and unnecessary animations. When relevant, actual maps, seating plans, campus layouts, or other visual displays that combine real images with data should be populated.

 Lacks Family Currently
 Part of the Hubble Ultra-Deep Field image showing a typical section of space containing galaxies int
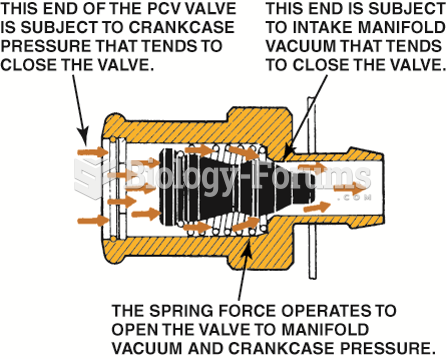 Spring force, crankcase pressure, and intake manifold vacuum work together to regulate the flow rate ...
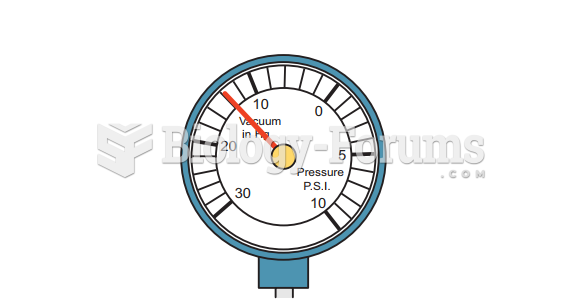 Vacuum Tests: Steady Fluctuating Vacuum
 My family