This topic contains a solution. Click here to go to the answer
|
|
|

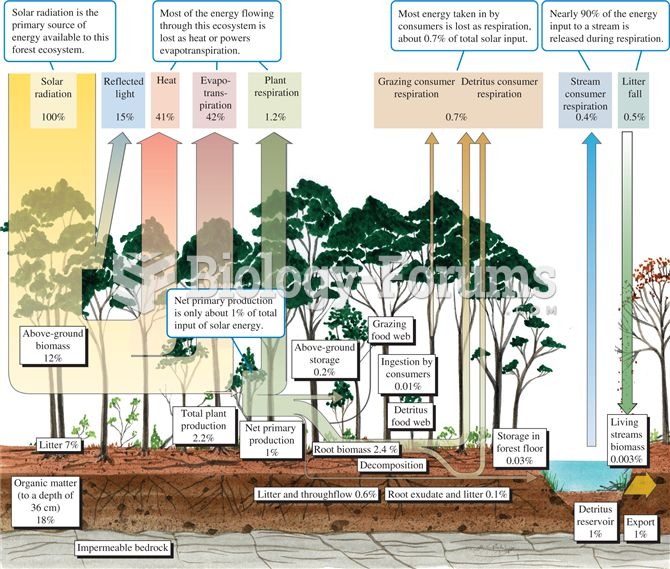 Energy budget for a temperate deciduous forest (data from Gosz et al. 1978).
 Pocket gophers and ecosystem structure (data from Huntly and Inouye 1988).
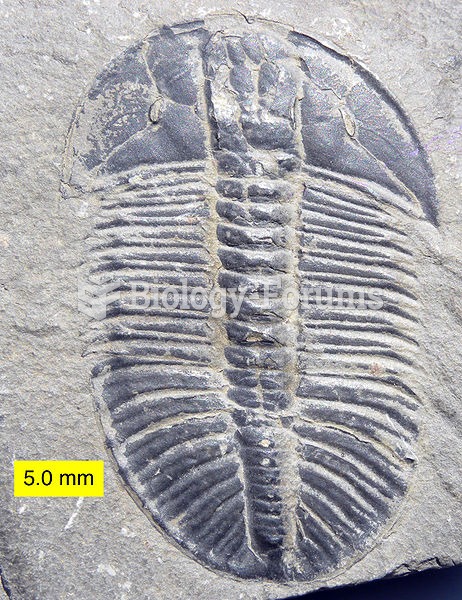 Olenoides erratus from the Mt. Stephen Trilobite Beds (Middle Cambrian) near Field, British Columbia
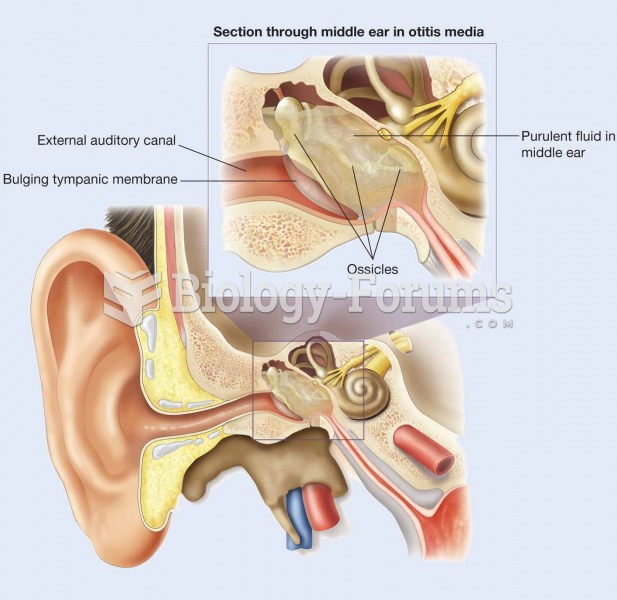 In acute otitis media, the tympanic membrane is usually bulging and purulent fluid is present in the
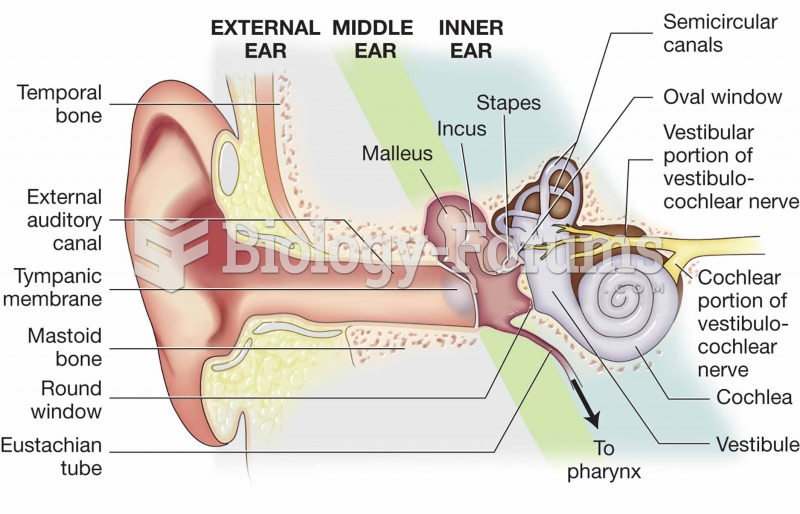 Structures of the middle ear and inner ear.
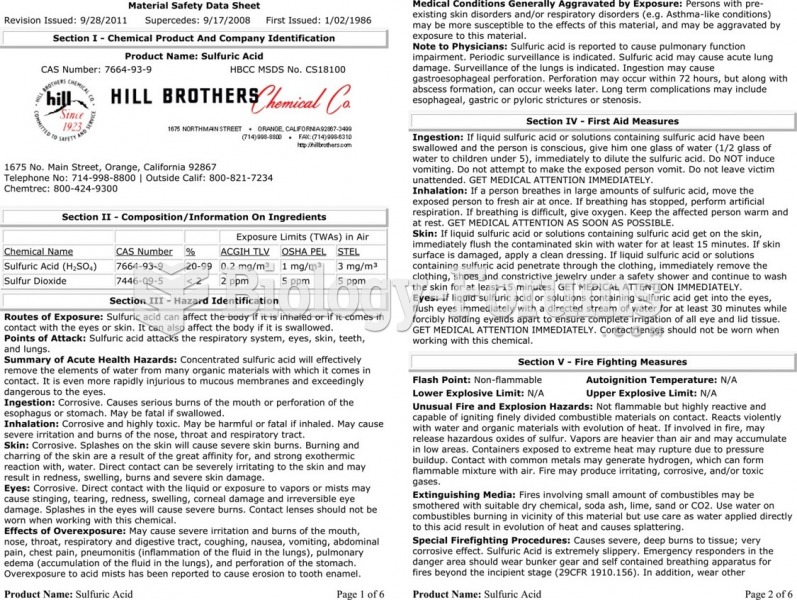 The material safety data sheet (MSDS) for sulfuric acid showing the detailed technical information ...