This topic contains a solution. Click here to go to the answer
|
|
|

 Standard Schnauzer
 Auscultation of Aortic Bruits with Bell of Stethoscope
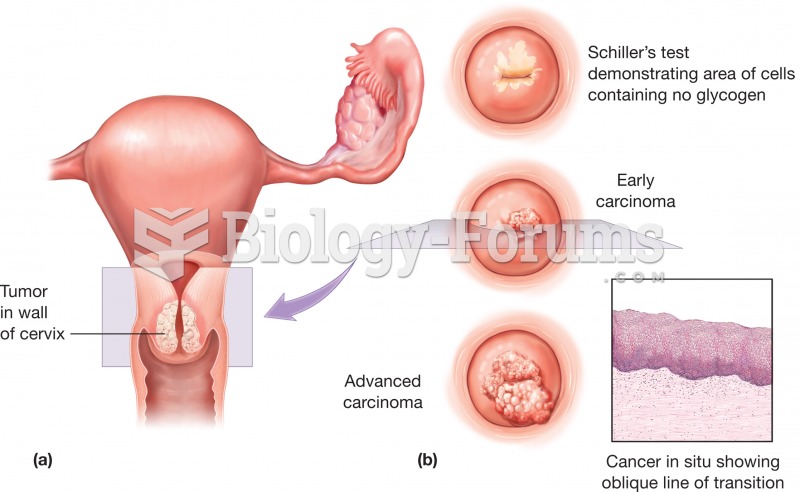 Cervical cancer (a) Top view of the uterus showing the presence of a tumor in the wall of the cervix
 2 Several oxygen-binding curves: for normal hemoglobin
 Visual tracking of a pendulum by a normal control subject (top) and three schizophrenics. (Adapted ...
 Stethoscope with both a bell-shaped and flat-disc amplifier