This topic contains a solution. Click here to go to the answer
|
|
|

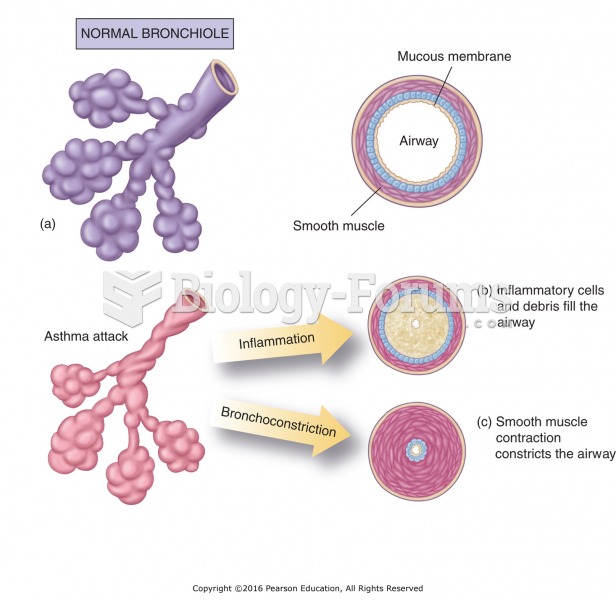 Changes in the bronchioles during an asthma attack: (a) Normal bronchiole. (b) The inflammatory ...
 How to create a sine equation when the curve is given
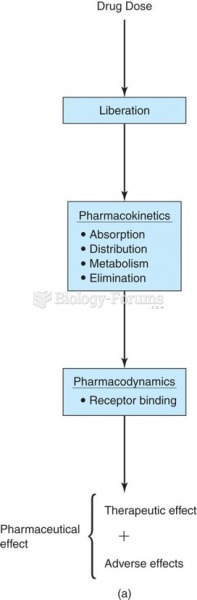 Generalized scheme showing the contribution of absorption, distribution, metabolism, elimination, ...
 Write the following in standard form
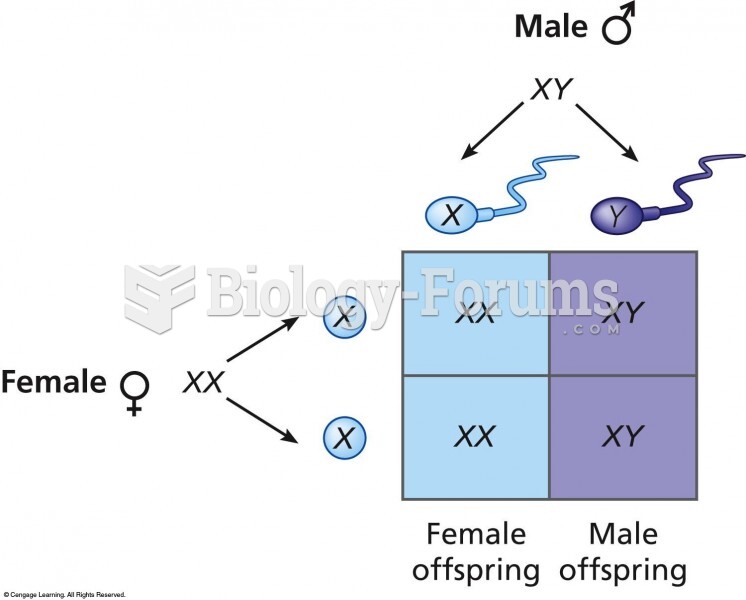 Distribution of sex chromosomes from generation to generation. All children receive an X chromosome
 Action of FMRP protein in normal and fragile-X cells