Answer to Question 1
ANSWER: A final forecast chart representing the atmosphere at a specific future time is called a prognostic chart or prog. Computer progs are known as machine-made forecasts. Modern electronic computers can analyze large quantities of data extremely fast. Each day, the many thousands of observations transmitted to NCEP are fed into a high-speed computer, which plots and draws lines on surface and upper-air charts. Meteorologists interpret the weather patterns and then correct any errors that may be present during their analysis. The routine daily forecasting of weather by the computer has come to be known as numerical weather prediction. To help forecasters handle all the available charts and maps, high-speed data modeling systems using computers are employed. The communication system in use today is known as AWIPS (Advanced Weather Interactive Processing System).
Answer to Question 2
ANSWER: The models are programmed into the computer, and surface and upper-air observations of temperature, pressure, moisture, winds, and air density are fed into the equations. To determine how each of these variables will change, each equation is solved for a small increment of future time, say, five minutes, for a large number of locations called grid points, each situated a given distance apart. In addition, each equation is solved for as many as 50 levels in the atmosphere. The results of these computations are then fed back into the original equations. The computer again solves the equations with the new data, thus predicting weather over the following five minutes. This procedure is done repeatedly until it reaches some desired time in the future, usually 12, 24, 36, or 48 hours. The computer then analyzes the data and draws the projected positions of pressure systems with their isobars or contour lines.

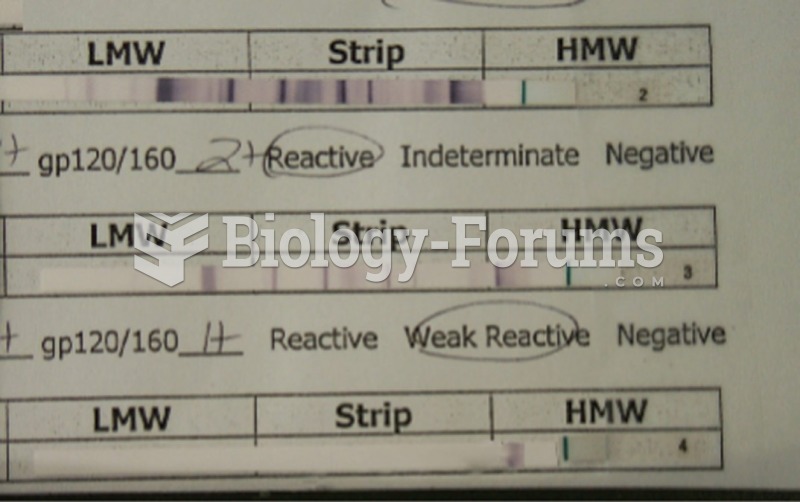 Western blot analysis of viral antigens. The nitrocellulose strips from the kit contain blotted ...
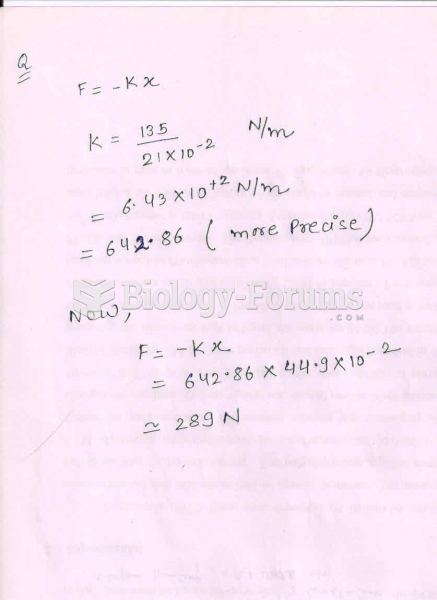 A very light ideal spring stretches by when it is used to hang a 135-N object. What is the ...
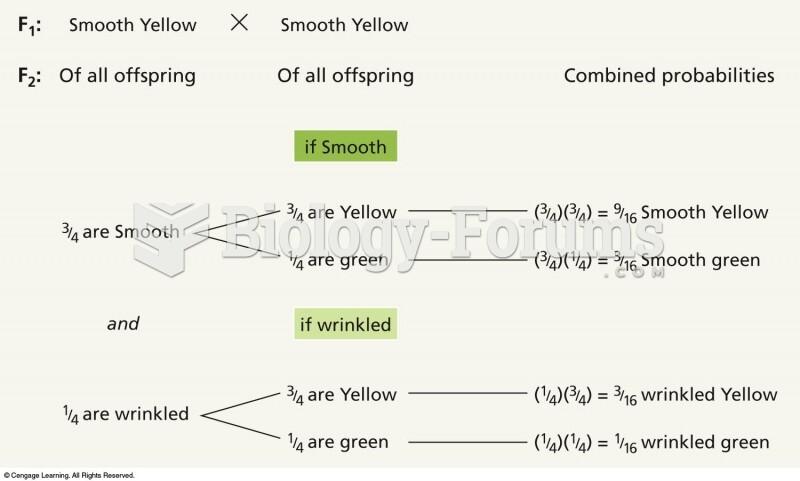 Analysis of a dihybrid cross involving two traits. Each trait is analyzed separately, then the frequ
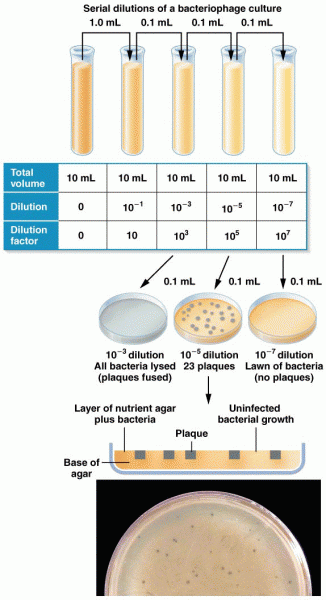 A plaque assay for bacteriophage analysis
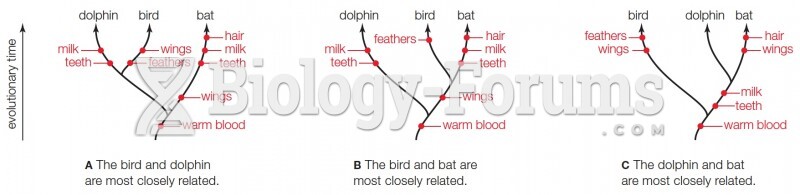 Parsimony Analysis
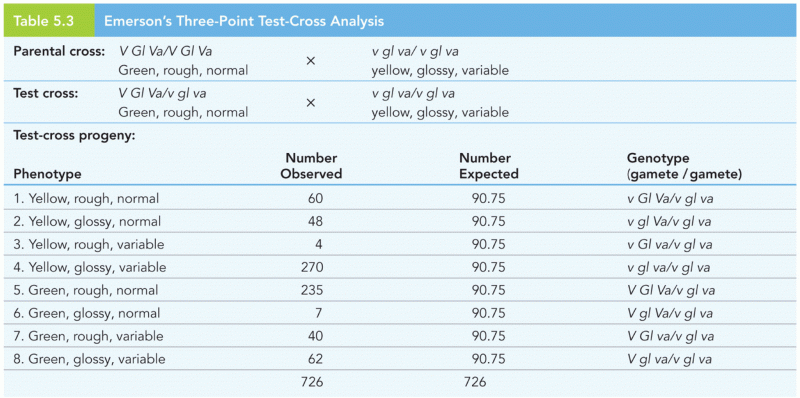 Emerson’s Three-Point Test-Cross Analysis