Arranging a country's population along a bar graph representing ages and genders creates a population
A) pyramid.
B) graph.
C) demograph.
D) map.
E) line.
Question 2
To calculate a country's dependency ratio, one needs to know the country's population and
A) the number of children still receiving financial support from their parents.
B) the number of people who are actively looking for work but are unable to find it.
C) all of a country's population younger than age 15 or older than age 64.
D) the number younger than age 15.
E) the number older than age 64.

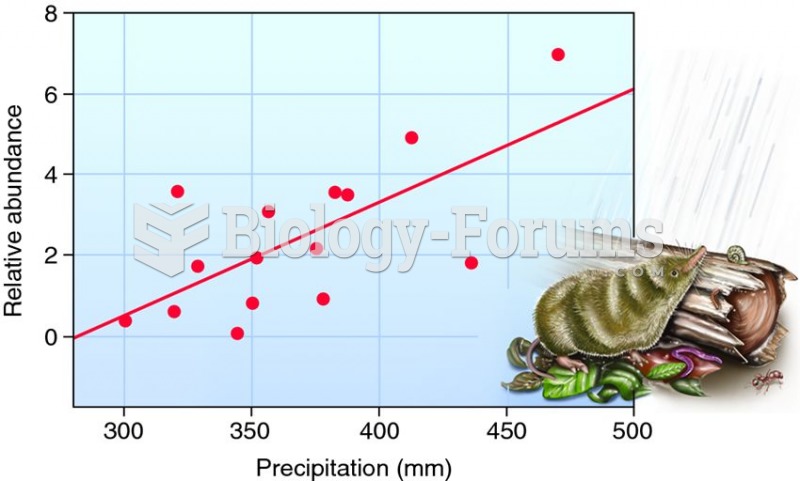 Abiotic factors influence population densities.
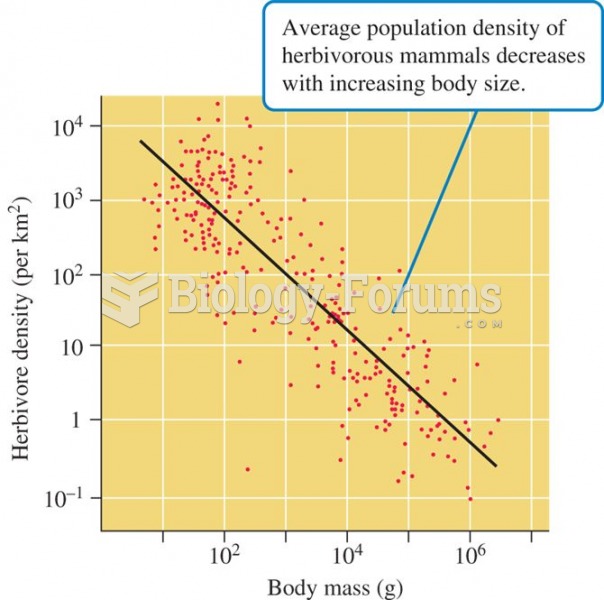 Body size and population density of herbivorous mammals
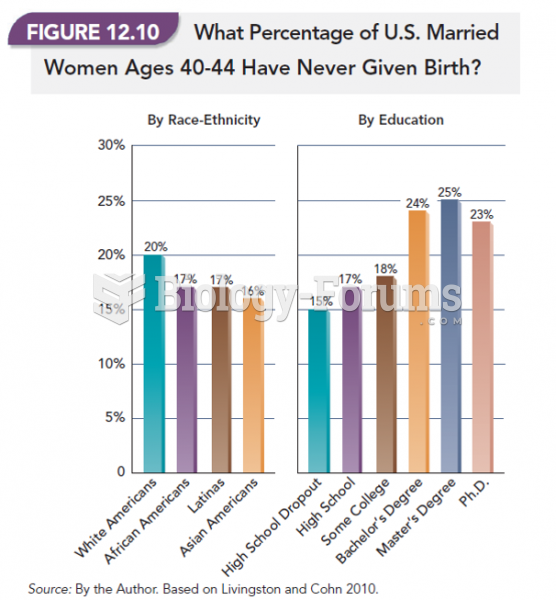 What Percentage of U.S. Married Women Ages 40-44 Have Never Given Birth?
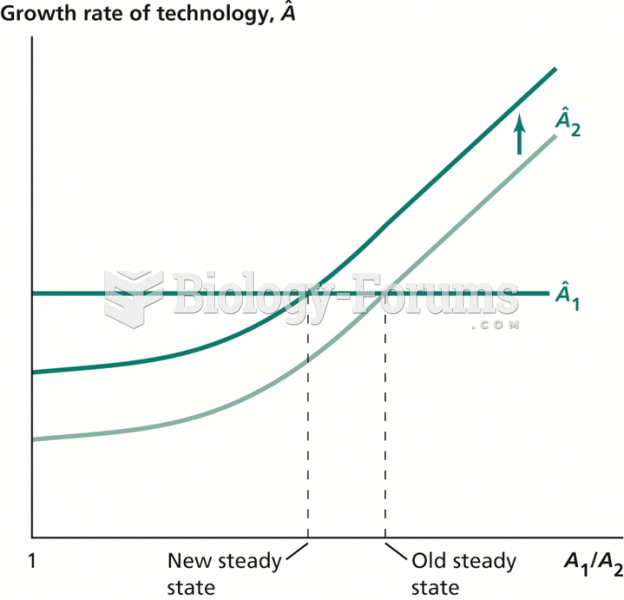 Effect of an Increase in R&D in the Follower Country on the Steady State
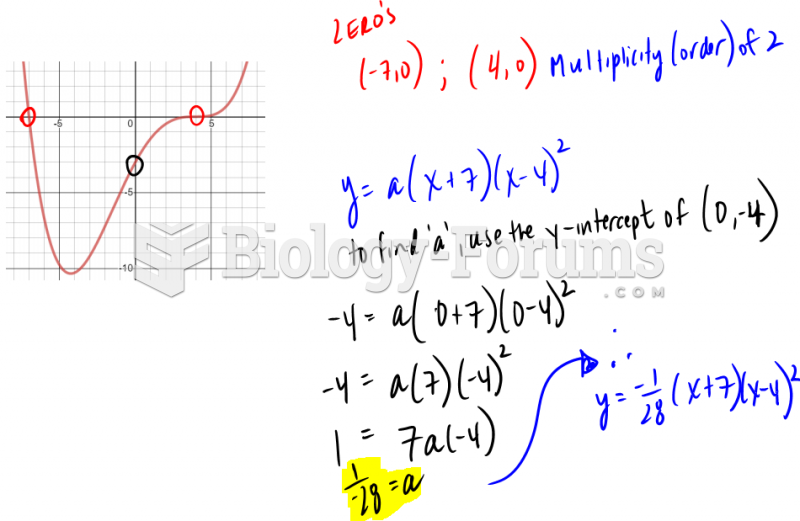 Converting cubic graph to function
 graph
graph