This topic contains a solution. Click here to go to the answer
|
|
|

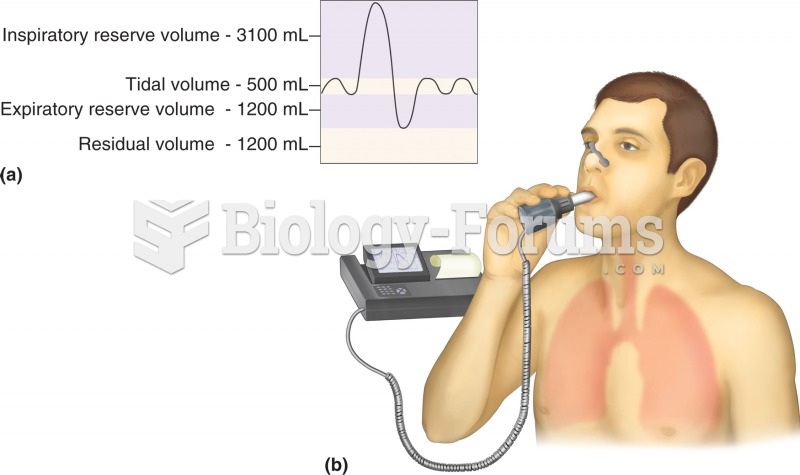 Pulmonary function test: spirometry. (a) Normal respiratory volumes, as measured during spirometry.
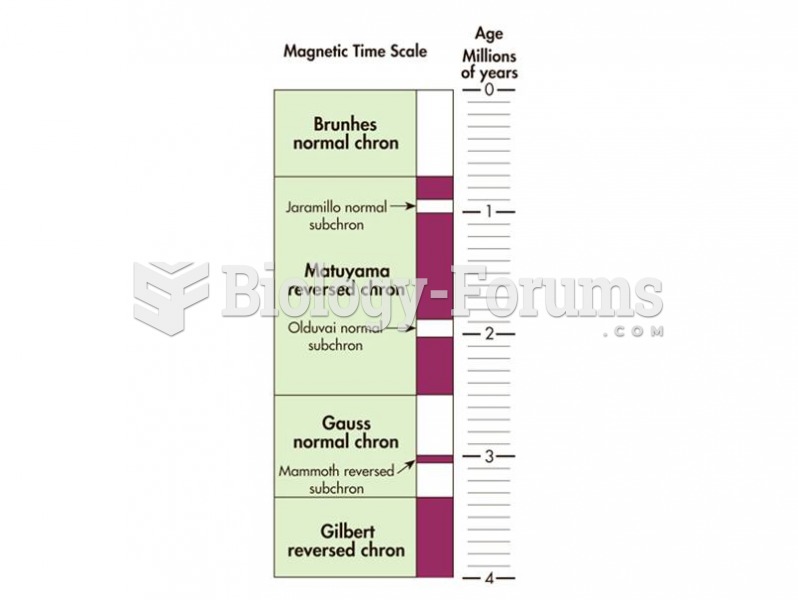 The geomagnetic polarity time scale shows how Earth’s magnetic pole has changed through geologic tim
 Students rated their grandparents on a scale from 1 to 4 based on emotional closeness, time spent ...
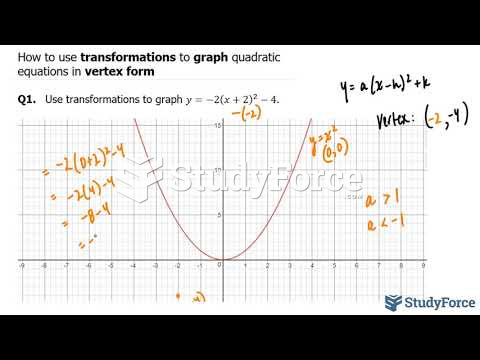 How to use transformations to graph quadratic equations in vertex form
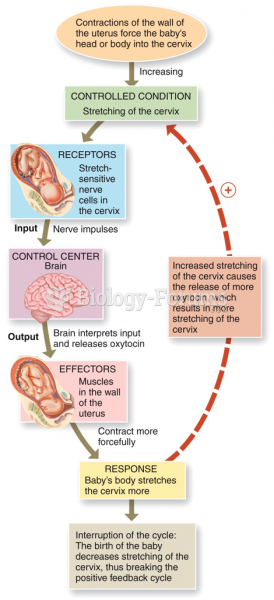 Control of Homeostasis: Positive Feedback
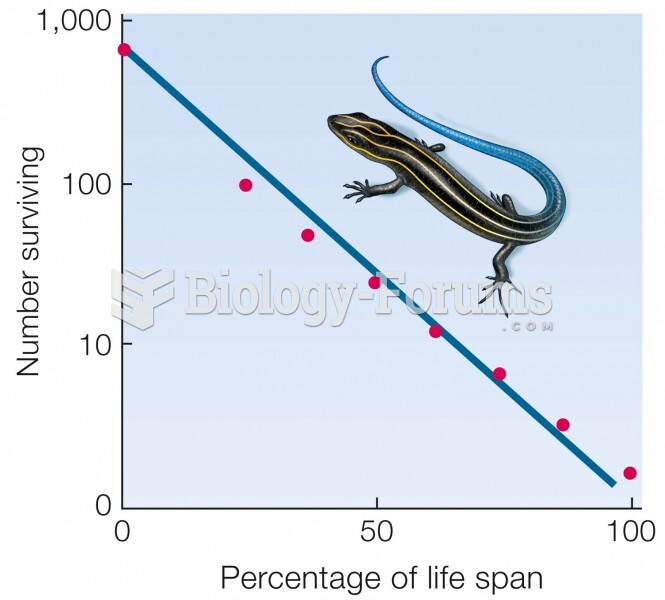 Type II curve. Mortality does not vary with age. Data for five-lined skink (Eumeces fasciatus).