This topic contains a solution. Click here to go to the answer
|
|
|

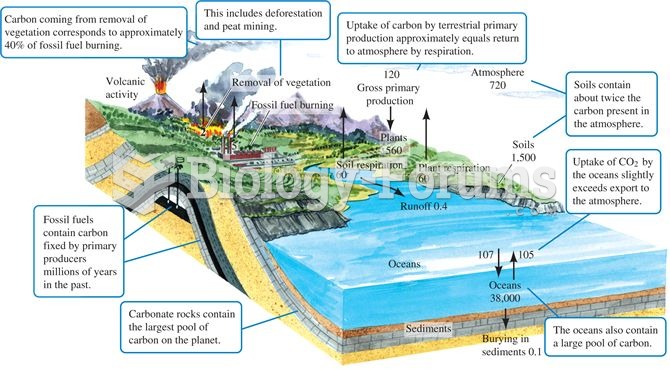 The carbon cycle. Numbers are storage as 1015 g or fluxes as 1015 g per year (data from Schlesinger
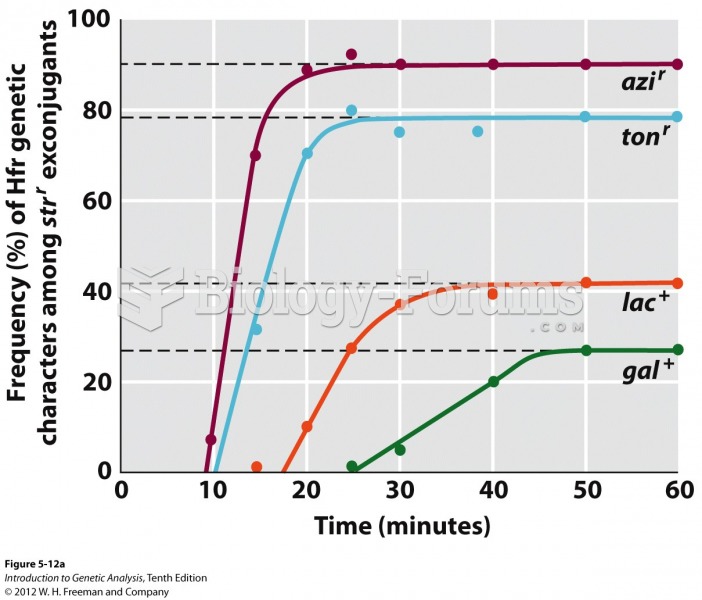 Tracking time of marker entry generates a chromosome map
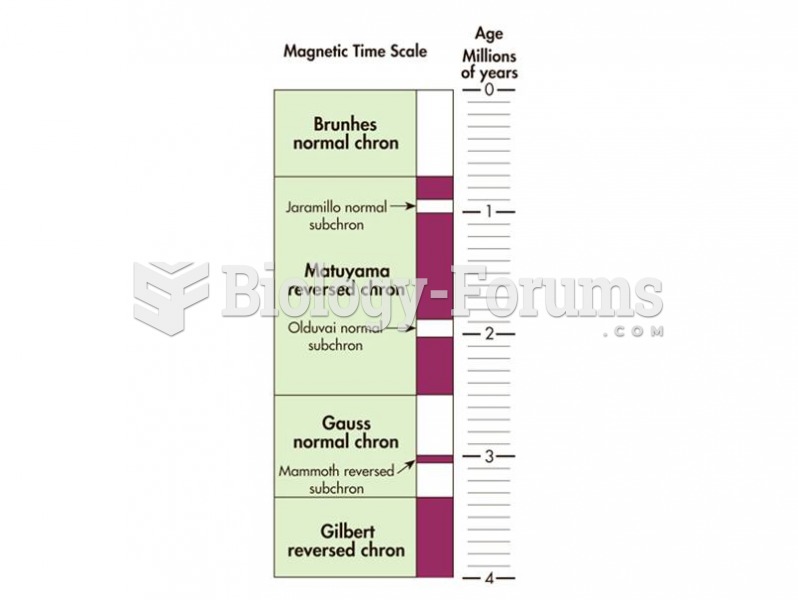 The geomagnetic polarity time scale shows how Earth’s magnetic pole has changed through geologic tim
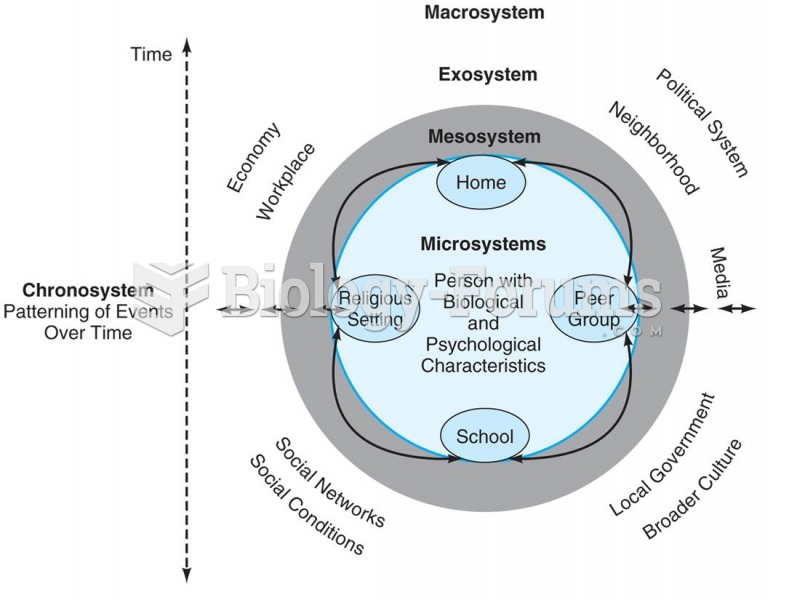 Bronfenbrenner’s model of the ecological-systems approach to studying development. He suggested that
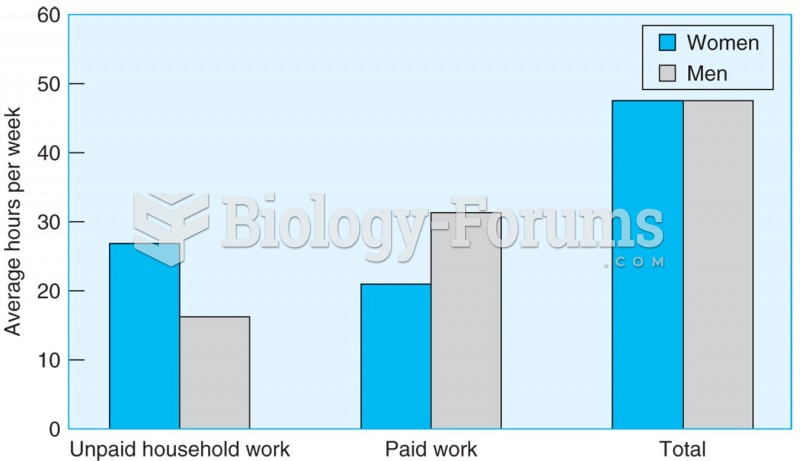 Men and women work the same number of hours a week, but men spend more time on paid work, and women ...
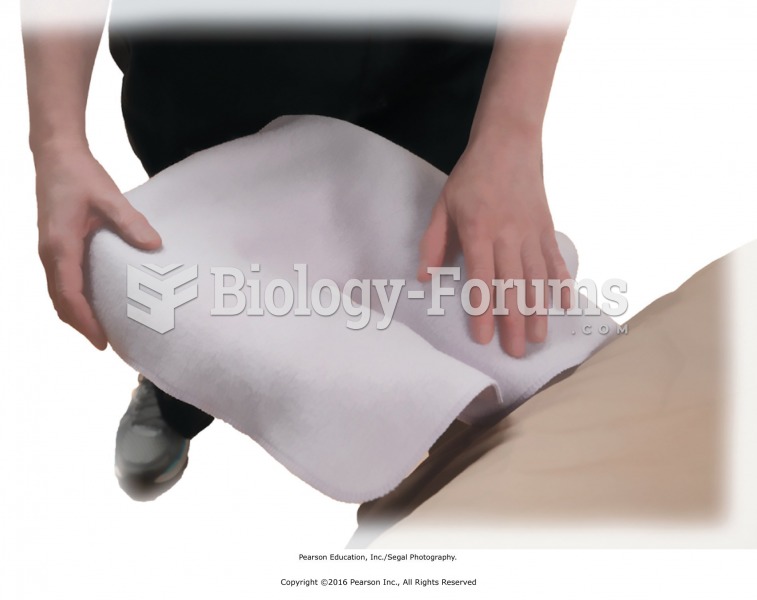 Use face cradle covers to prevent the client’s skin from touching the face cradle upholstery.