Answer to Question 1
ANS: B
Interpretation of the pulmonary function report: Interpretive strategies for pulmonary function testing abound. Most computer-based pulmonary function testing systems have algorithms in their software programs for computer-assisted interpretations of the pulmonary function report. A consensus for interpreting test results is growing. Table 20-8 summarizes pulmonary function changes that may occur in advanced obstructive and restrictive patterns of lung diseases, and Figure 20-16 presents a simple algorithm to assess pulmonary function test results in clinical prac-tice. When considering a pulmonary function report, the FEV1/VC ratio is a good place to start, because it provides an initial focus as normal, restrictive, or obstructive impairment. When the FEV1/FVC is less than the limit of normal (LLN), there is airway obstruction. When the FEV1/FVC is greater than the LLN, there is no airway obstruction. The LLN FEV1/FVC can be determined directly for various population using regression equations in Table 20-9 or simply estimated at 70. If the FEV1/FVC ratio is greater than the LLN or 70 and if the TLC is less than the LLN, often defined as less than 80 predicted normal, the patient has a restrictive im-pairment, according to this algorithm. The severity of the restriction is based on the percent pre-dicted or on the number of standard deviations below the LLN TLC according to Table 20-2. If the FEV1/FVC ratio is less than 70, the patient likely has an obstructive impairment; the se-verity of the obstruction is based on the percent predicted normal FEV1 according to Table 20-2. If the percent predicted normal DLCO is less than 80, the patient has a diffusion impairment. Some laboratories also report the DLCO/VA ratio, which indexes the DLCO for lung volume measured during the single breath test. If the DLCO/VA ratio is also less than 80 of the in-dexed value, the cause of the diffusion impairment is considered within the lung, and if the DLCO/VA ratio is greater than 80 of the indexed value, the cause of the diffusion impairment is considered due to small lung volume.
Answer to Question 2
ANS: D
Interpretation of the pulmonary function report: Interpretive strategies for pulmonary function testing abound. Most computer-based pulmonary function testing systems have algorithms in their software programs for computer-assisted interpretations of the pulmonary function report. A consensus for interpreting test results is growing. Table 20-8 summarizes pulmonary function changes that may occur in advanced obstructive and restrictive patterns of lung diseases, and Figure 20-16 presents a simple algorithm to assess pulmonary function test results in clinical prac-tice. When considering a pulmonary function report, the FEV1/VC ratio is a good place to start, because it provides an initial focus as normal, restrictive, or obstructive impairment. When the FEV1/FVC is less than the limit of normal (LLN), there is airway obstruction. When the FEV1/FVC is greater than the LLN, there is no airway obstruction. The LLN FEV1/FVC can be determined directly for various population using regression equations in Table 20-9 or simply estimated at 70. If the FEV1/FVC ratio is greater than the LLN or 70 and if the TLC is less than the LLN, often defined as less than 80 predicted normal, the patient has a restrictive im-pairment, according to this algorithm. The severity of the restriction is based on the percent pre-dicted or on the number of standard deviations below the LLN TLC according to Table 20-2. If the FEV1/FVC ratio is less than 70, the patient likely has an obstructive impairment; the se-verity of the obstruction is based on the percent predicted normal FEV1 according to Table 20-2. If the percent predicted normal DLCO is less than 80, the patient has a diffusion impairment. Some laboratories also report the DLCO/VA ratio, which indexes the DLCO for lung volume measured during the single breath test. If the DLCO/VA ratio is also less than 80 of the in-dexed value, the cause of the diffusion impairment is considered within the lung, and if the DLCO/VA ratio is greater than 80 of the indexed value, the cause of the diffusion impairment is considered due to small lung volume.


 Changes in boreal forest composition along a chronosequence in Quebec. Dates refer to the year of th
 Blood Collection Tubes: Order of Draw
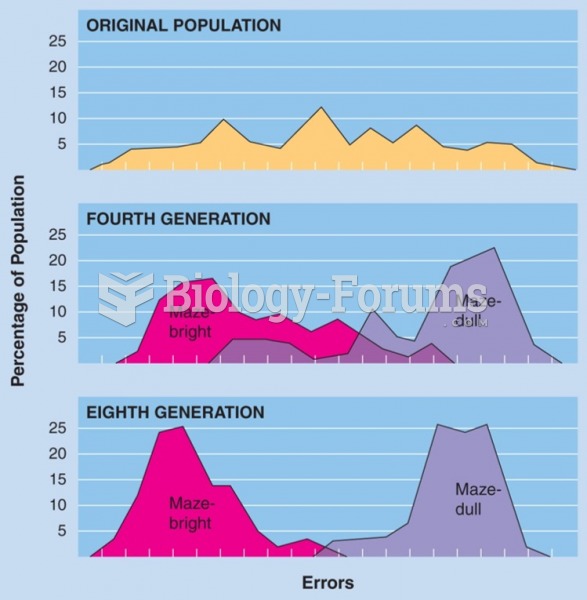 Selective breeding of maze-bright and maze-dull strains of rats by Tryon (1934). (Data from Cooper, ...
 What single payment one year from now would be economically equivalent to payments of $1,000 ...
 Satellite data on primary productivity in the equatorial Pacific Ocean
 Linkage Data from 39 Families with Cystic Fibrosis