|
|
|

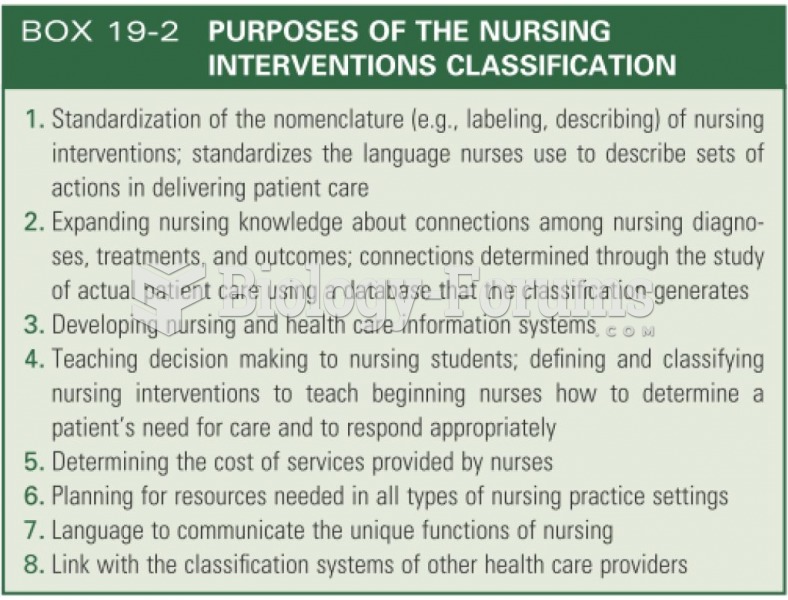 Purpose of the nursing interventions
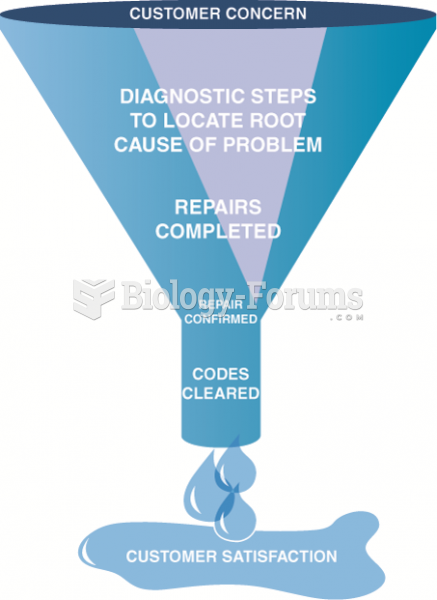 A funnel is one way to visualize the diagnostic process. The purpose is to narrow the possible ...
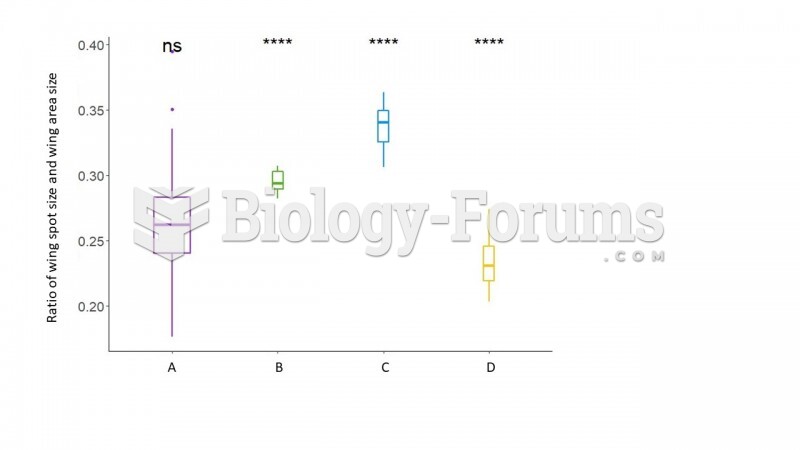 boxplot
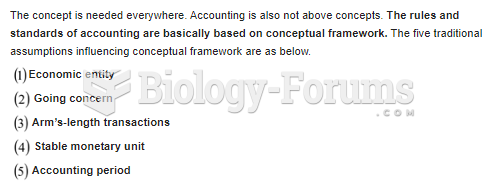 Describe the Conceptual Forecasting Framework in your own words.
 Describe the Conceptual Forecasting Framework in your own words.
 Describe the Conceptual Forecasting Framework in your own words.