|
|
|

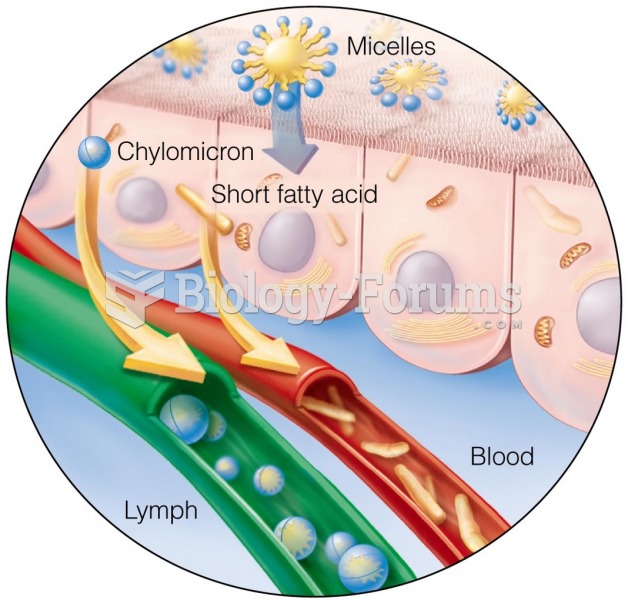 Describe how fat is digested, absorbed, and transported in the body
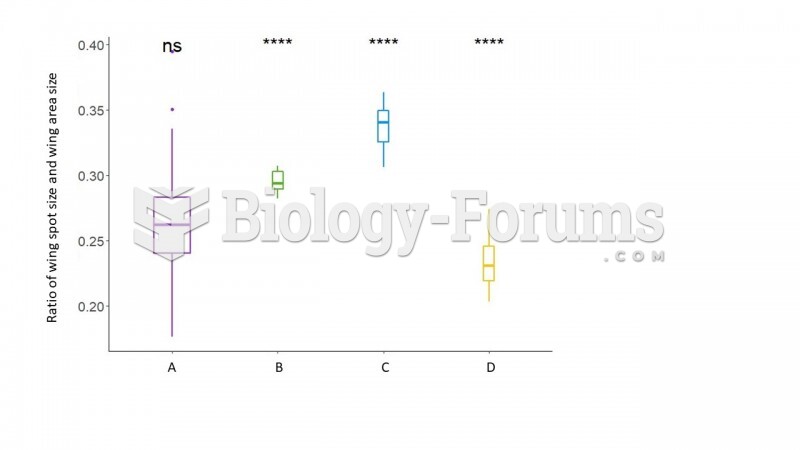 boxplot
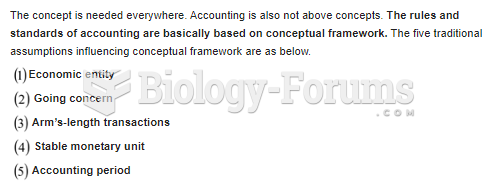 Describe the Conceptual Forecasting Framework in your own words.
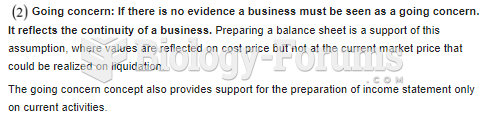 Describe the Conceptual Forecasting Framework in your own words.
 Describe the Conceptual Forecasting Framework in your own words.
 The purpose of mitosis is to take diploid cells and make two identical clones. A shows a simplified