This topic contains a solution. Click here to go to the answer
|
|
|

 Summary of US Census Data
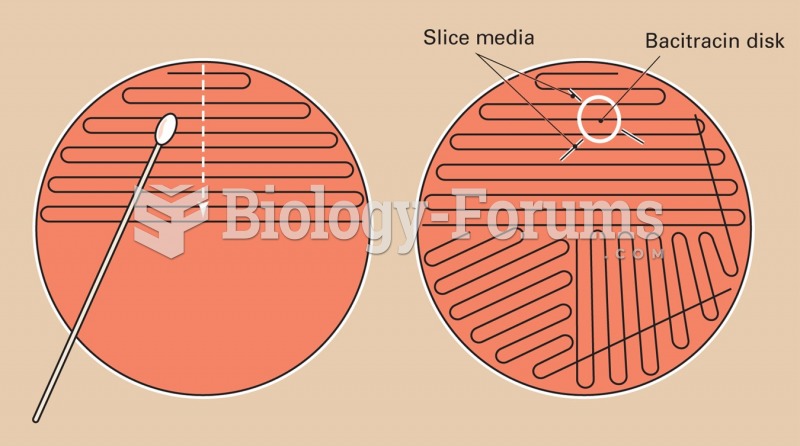 Swabbing a Petri dish to spread apart colonies. Bacitracin disk is used to prove the presence or ...
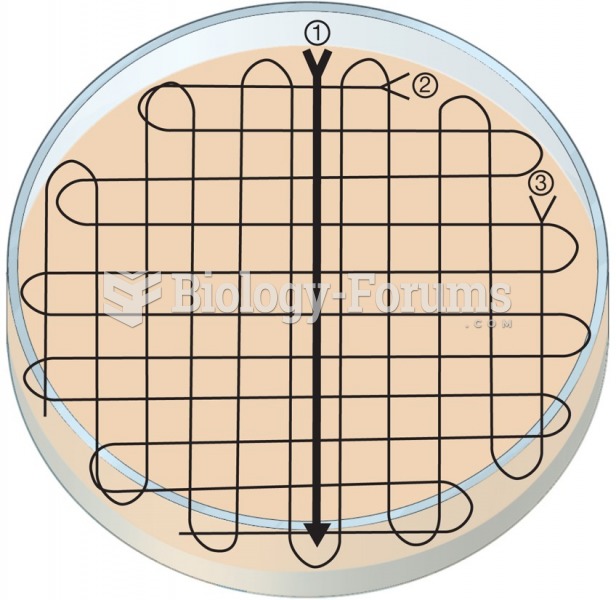 Lawn spread or colony count streaking.
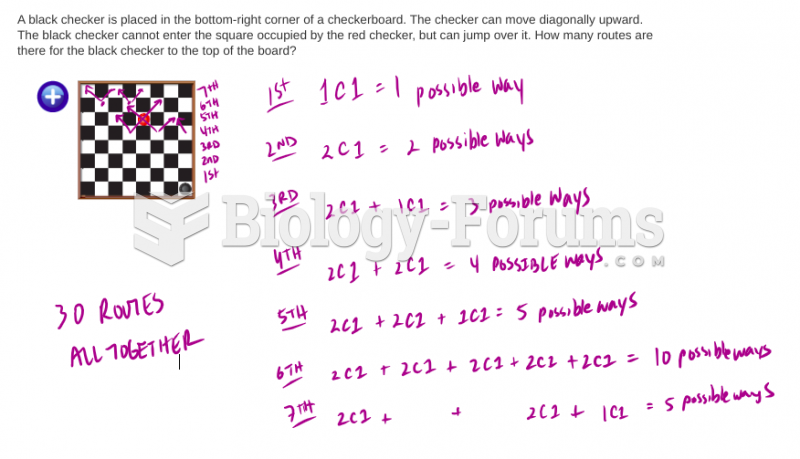 Data management questions
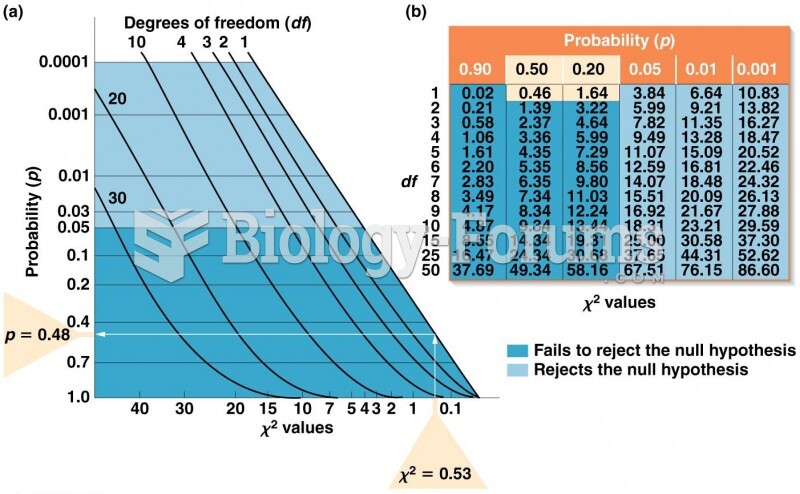 (a) Graph for converting values to p values. (b) Table of values for selected values of df
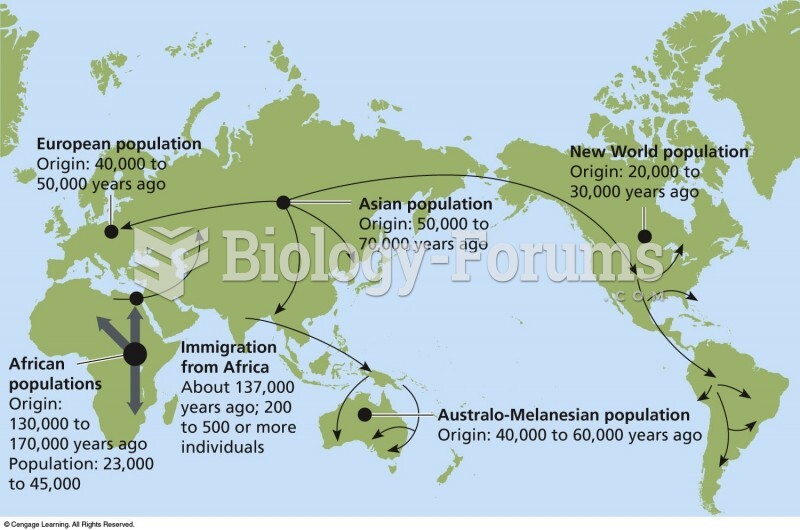 The origin and spread of modern H. sapiens, reconstructed from genetic and fossil evidence.