This topic contains a solution. Click here to go to the answer
|
|
|

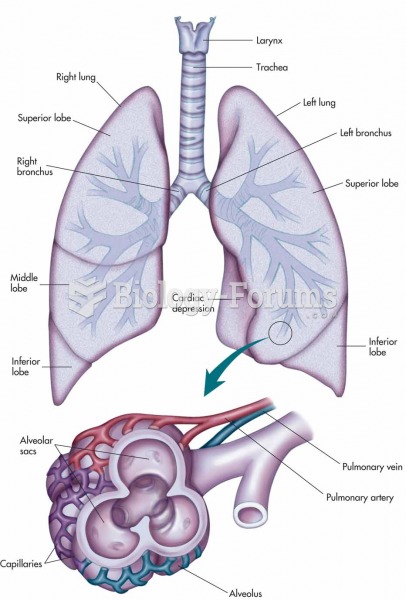 Larynx, trachea, bronchi, and lungs with an expanded view showing the structures of an alveolus and
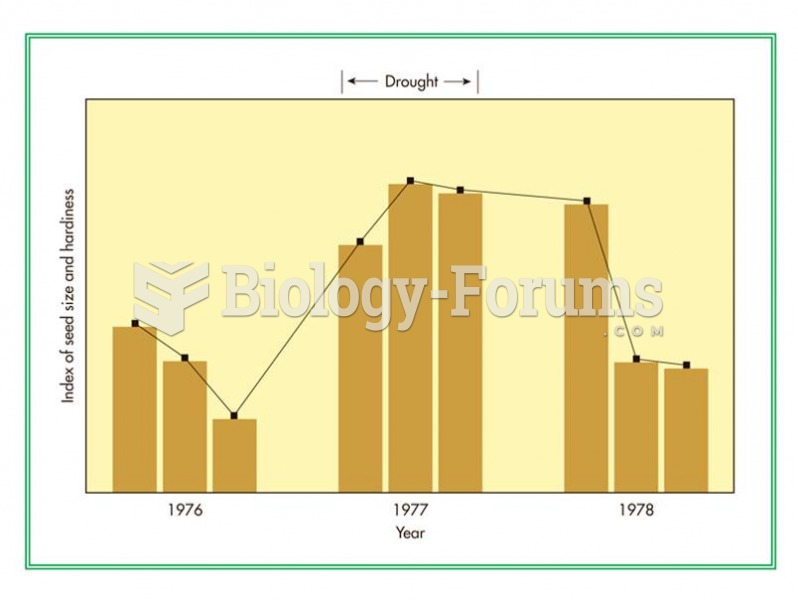 Index of seed size and hardiness prior to, during, and after drought.
 Leadership is not about size, it's about knowledge and wisdom
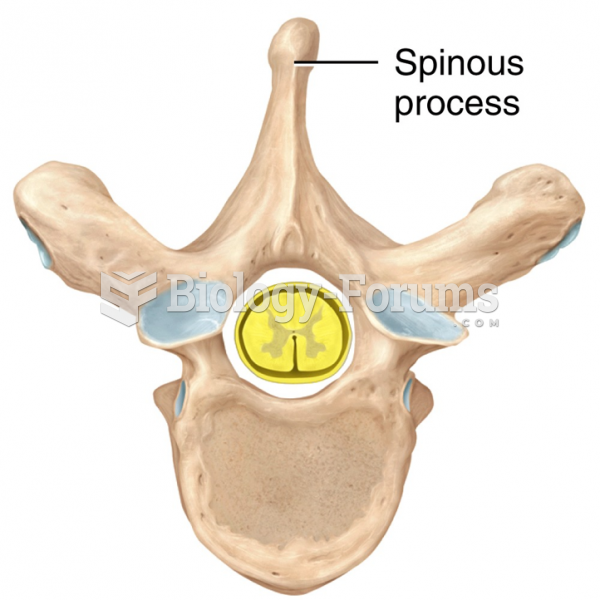 Spinous process
 The effect of disruptive selection on bristle number in Drosophila
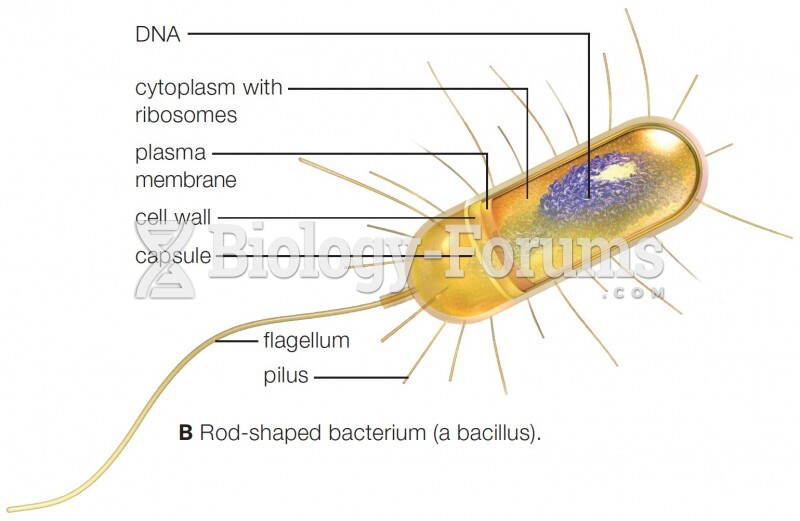 Typical bacterial size and structure