|
|
|

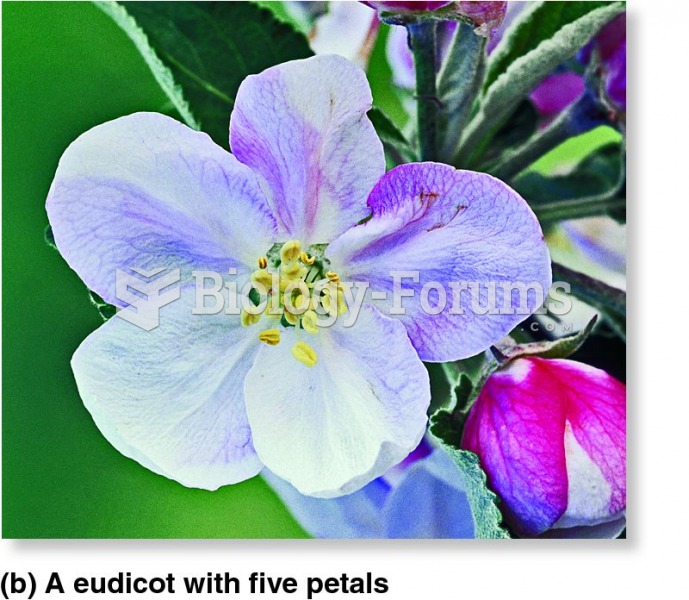 Flower part number is a characteristic difference between monocots and eudicots
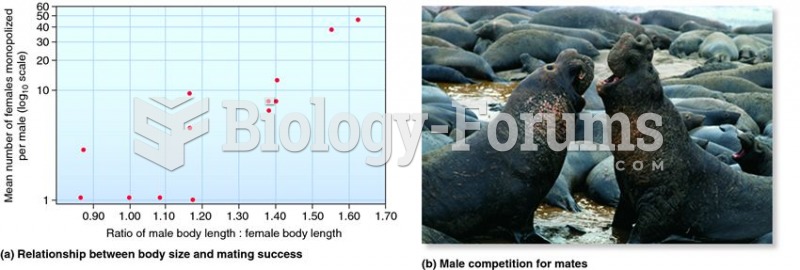 Large male size and mating success.
 Team of geologists collecting samples for paleomagnetic analysis at Sangiran, Java.
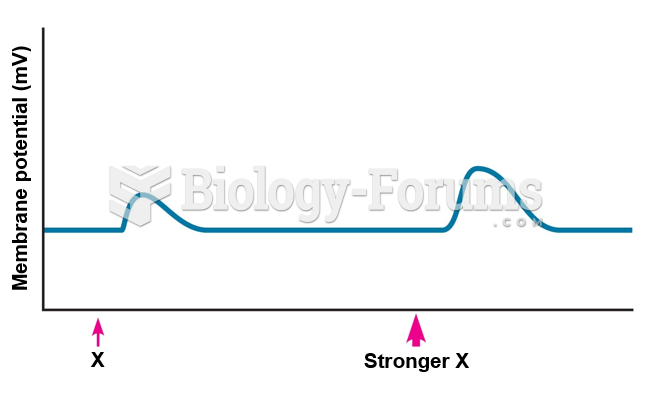 Effect of stimulus strength on size of graded potential.
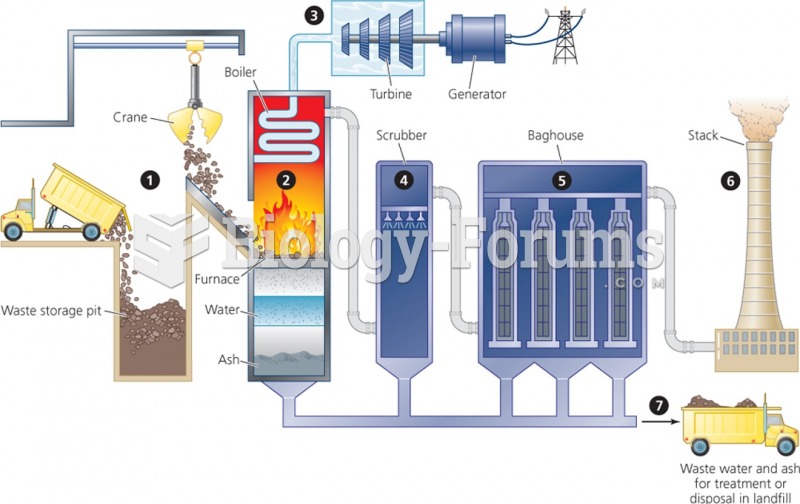 Incineration Process
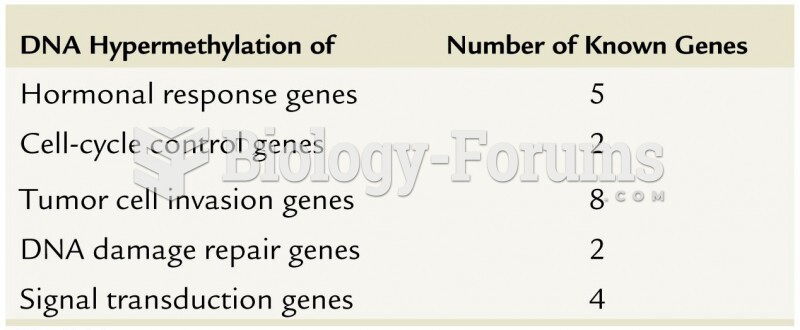 DNA Hypermethylation of Number of Known Genes