|
|
|

 This graphic illustrates the original systems model of politics advanced by David Easton. Politics
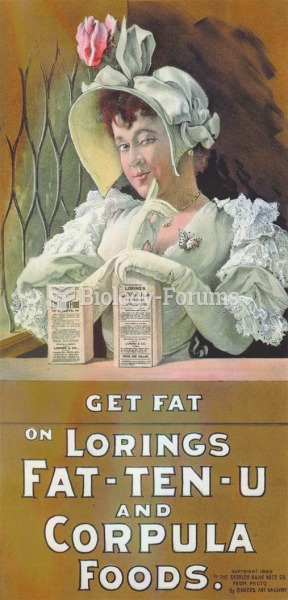 Early in the twentieth century, when malnutrition was common, companies such as this one advertised
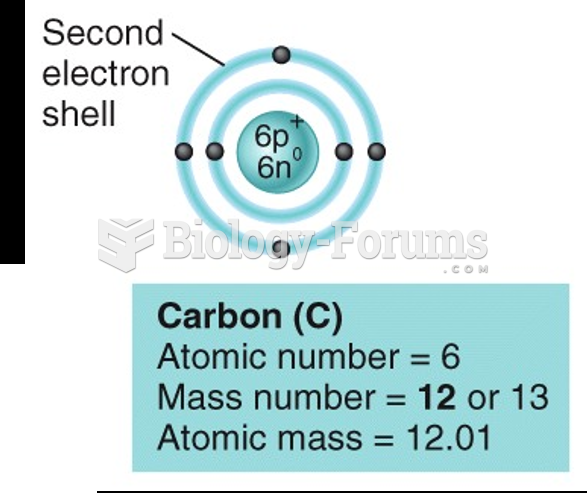 Atomic Number and Mass Number
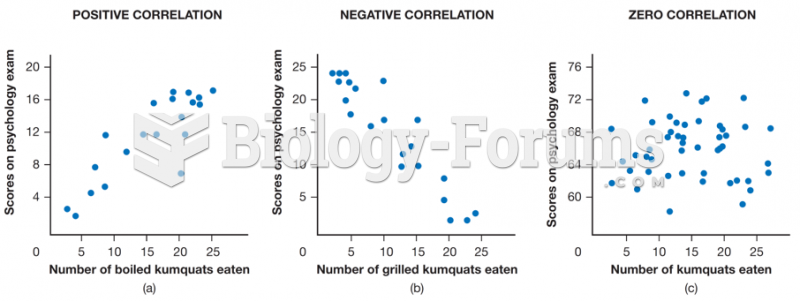 Correlations between scores on a psychology test and number of boiled kumquats eaten per month
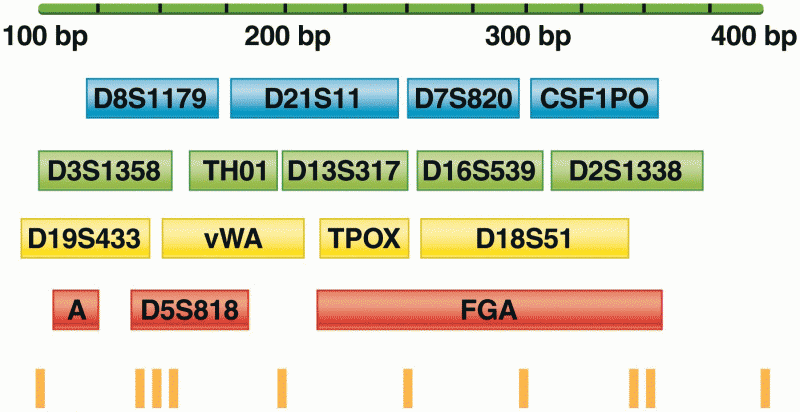 Relative size ranges and fluorescent dye labeling colors of 16 STR
 The process of margination