|
|
|

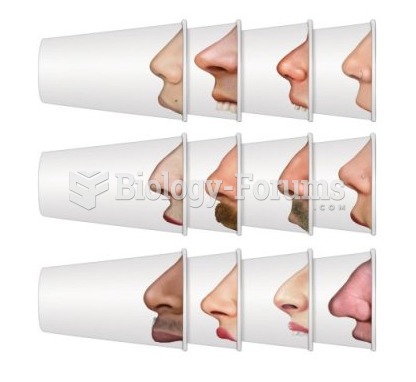 Nose Size
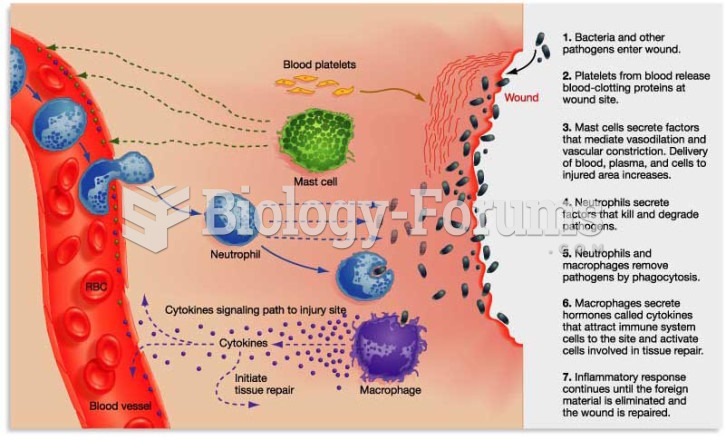 Inflammation Process
 Color mixtures of reflected pigment—subtractive process
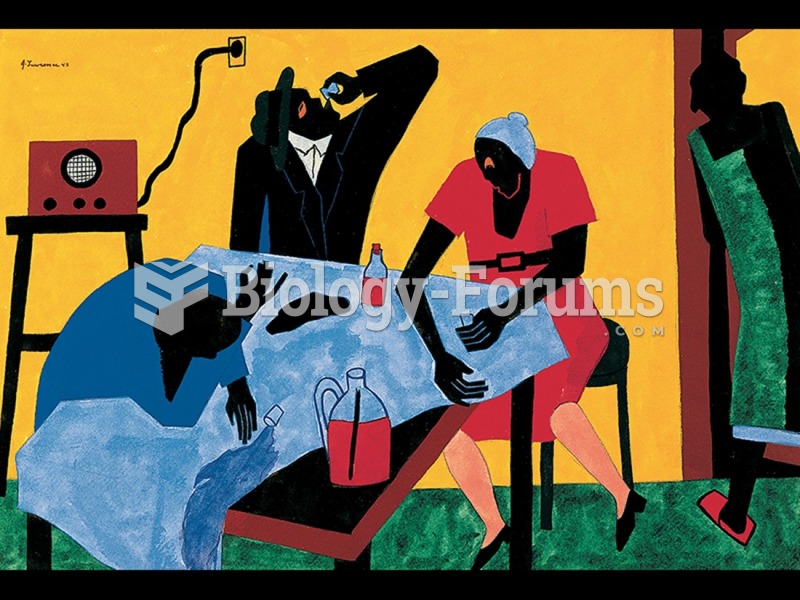 Jacob Lawrence, You can buy bootleg whiskey for twenty-five cents a quart, from the Harlem Series.
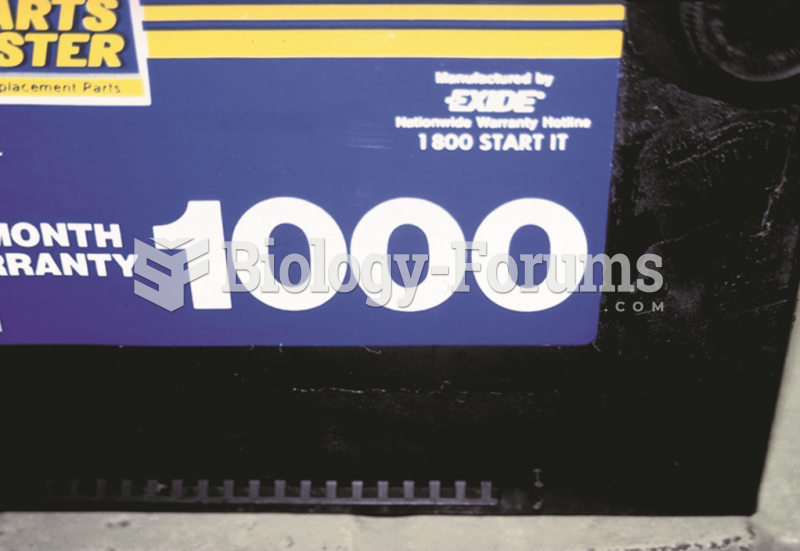 This battery shows a large “1000” on the front panel but this is the CA rating and not the ...
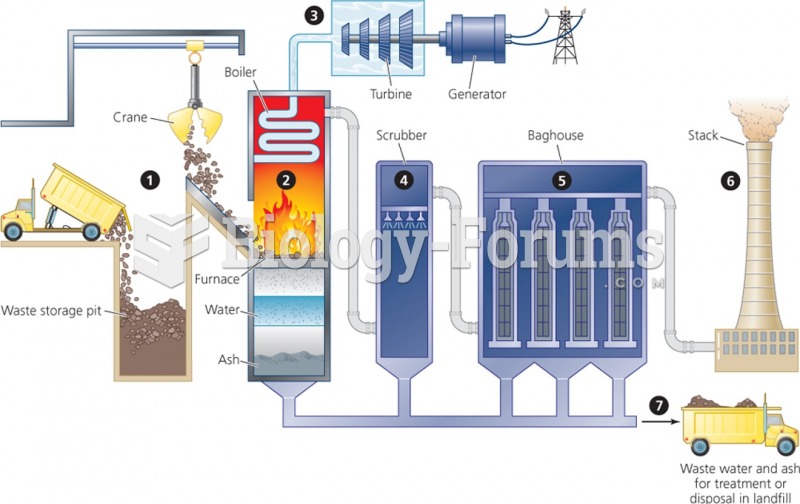 Incineration Process