This topic contains a solution. Click here to go to the answer
|
|
|

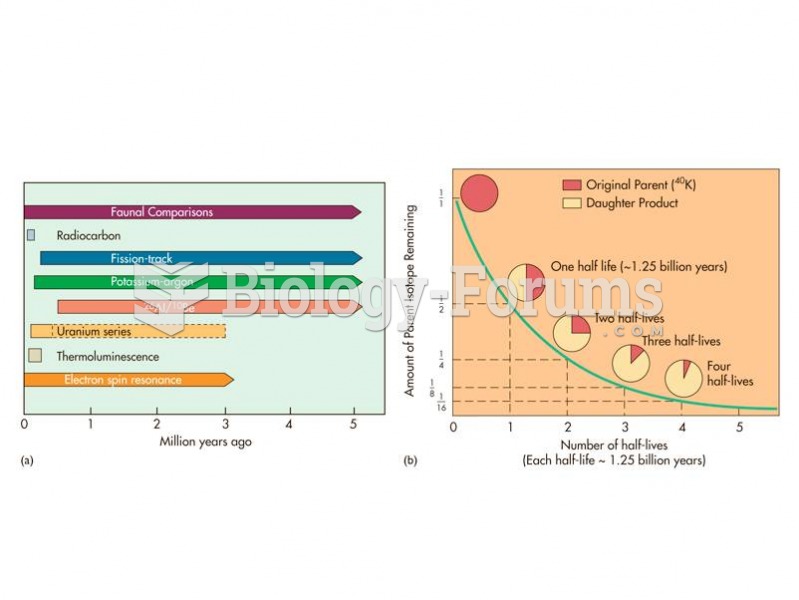 (a) The relative age ranges of different dating techniques depend upon the half-life of the system u
 The relative penetrating power of alpha, beta, and gamma radiation. Gamma and neutron radiation are ...
 A 2-kg box of taffy candy has 40 J of potential energy relative to the ground. Its height above ...
![What is the [OH-] in a seawater sample if the pH is 8.65?](https://biology-forums.com/gallery/43/medium_6_11_01_22_1_38_03.png) What is the [OH-] in a seawater sample if the pH is 8.65?
What is the [OH-] in a seawater sample if the pH is 8.65?
 Relative size ranges and fluorescent dye labeling colors of 16 STR
 Relative levels of neuronal loss in HD transgenic mice