|
|
|

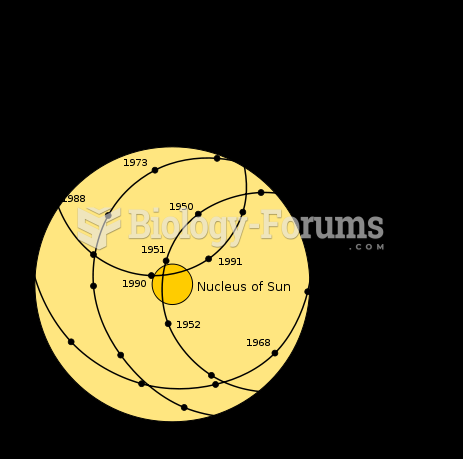
 Motion of the barycenter of the Solar System relative to the Sun
 Motion of the barycenter of the Solar System relative to the Sun
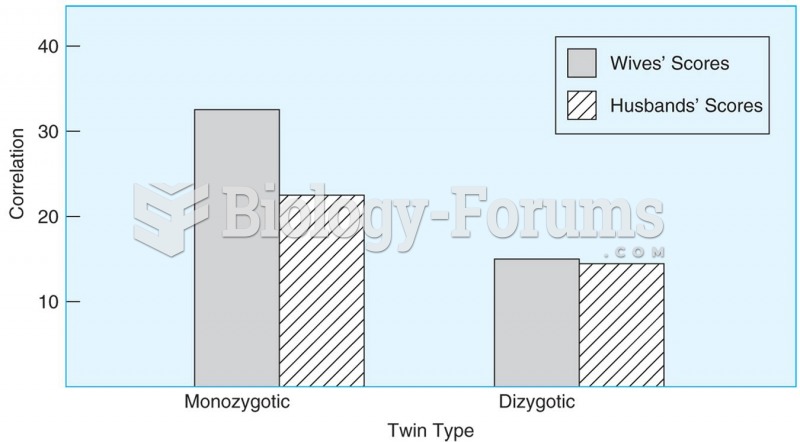 Women who are monozygotic twins and have the same genes are more similar in their marital happiness
 The Ford logo on display at the 2009 New York International Auto Show.
 How would you rate your overall health?” The percent of adults answering “excellent” or ...
 The first step is to verify the proper operation of the tester by measuring the air frequency by ...